
Article · Volume 15, Issue 3 · pp. 839–859
Data-Driven Predictive Analytics in Textile Retail Marketing: A Bibliometric-Systematic Literature Review (2016-2025)
G Pavi Sathya1, G Sudha1
- 1Department of Management, Central University of Tamil Nadu, Thiruvarur, Tamil Nadu, INDIA.
Abstract
This paper aims to fill the gap in scientific literature by conducting a hybrid Bibliometric-Systematic Literature Review (B-SLR) to create a comprehensive synthesis of literature evidence on data-driven predictive analytics in retail marketing for the textile and apparel sectors. A deduplicated corpus of 553 peer-reviewed articles (Scopus and Web of Science; 2016-2025) was analysed by exploring their performance analysis and science mapping using Bibliometrix R, VOSviewer, and Biblioshiny (10-step B-SLR protocol and PRISMA 2020 guidelines). A systematic content analysis and an inductive thematic synthesis was conducted with a subset of 171 textile-specific studies. The field has good exponential growth and is still in an active growth phase based on logistic growth modelling and Journal of Retailing and Consumer Services tops the list of outlets. Through science mapping, six conceptual clusters were identified via keyword co-occurrence analysis, while seven clusters of intellectual foundations emerged from the co-citation analysis of cited references. Eight thematic clusters were identified in the systematic review. This research offers a roadmap for textile retail practitioners on how to apply predictive analysis as demand forecasting, consumer engagement, and ethical supply chain management. A TCCM pinpoints five key research areas. Hybrid B-SLR in the domain with macro level intellectual structure mapping and micro level as well as the themes. It contributes to the scientometric literature by showing the applicability of the B-SLR protocol in an interdisciplinary technology-driven field.
Keywords: Artificial intelligence; Bibliometric analysis; Demand forecasting; Predictive analytics; Systematic literature review; Textile retail marketing
FULL TEXT
INTRODUCTION
The world textile and apparel industry, with an estimated valuation of over USD 1.7 trillion, and employability of roughly 300 million at its value chain, is at the heart of a data-driven paradigm shift (McKinsey and Company, 2024; Statista, 2025). The machine learning, artificial intelligence, and big data architectures-driven predictive analytics have emerged as a pillar of modern-day retail marketing approaches. The ability enables businesses to anticipate consumer actions, optimise the pricing process, model the demand, and provide highly personalised experiences at scale (Bradlow et al., 2017; Ferreira et al., 2016; Liu et al., 2020). These technologies were first presented as operational forecasting tools in the early 2010s, but have rapidly evolved to sophisticated marketing devices capable of rapidly reconfiguring consumer routes in real-time both online and in-store retail experience (Rooderkerk et al., 2023). It is projected that as early as 2027, the global retail market will reach USD 30 trillion, and data analytics will deliver more than USD 1.2 trillion in additional value through augmented demand acuity and customized interactions (McKinsey and Company, 2023; Statista, 2025).
The issues are particularly pressing in the context of the retail business in the textile industry, where fashion products have short life-cycles, extreme demand variability, high seasonality, moving trends under the impact of social media, and significant visual and aesthetic value (Choi, 2016; Ferreira et al., 2016). These characteristics seed some unique analytical bottlenecks that traditional retail paradigms often disregard, such as the cold-start issue when novel products have no historical data (Li and Du, 2024), the necessity of computer vision to analyse fashion images (Jagadeesh et al., 2014) and the constant social media scrutiny to discover micro-trends before they explode (Checco et al., 2022). Merchants who avoid predictive analytics risk falling into the eclipse of data-driven competitors: SHEIN launches 2000-3000 new designs a day based on its own handcrafted data analytics infrastructure (Zhang, 2021); Stitch Fix plans an algorithmic wardrobes business among 4 million customers (Grandinetti, 2020); and Zara maintains its own paradigm.
However, despite this urgently practical necessity, the scholarly writing on the subject is still divided and spread out in disciplines of operations management, information systems, consumer behaviour and fashion studies. Complete synthesis of the field has not yet been done, nor has the substantive contribution of the field been critically evaluated. Existing reviews are either excessively broad in their retail view (Cao, 2021; Rooderkerk et al., 2023; Weber and Schütte, 2019) or have specific sub-domains without tackling the issue of predictive analytics in a holistic way (Arora et al., 2019; Poushneh and Vásquez-Parraga, 2024). Moreover, the predictive analytics of textile retail have not been explored through bibliometric tools and studies on adjacent regions have not done this so far, an issue that has restricted the importance of an integrative review to synthesize available information, outline principal themed groups, and, finally, to determine how to bridge any methodological and theoretical gaps. In particular, the literature presupposes that special problems related to the demand forecasting of fashion products (because of the short lifetime of products and high volatility) are mostly ignored (Swaminathan and Venkitasubramony, 2023), not mentioning the so-called cold-start issue concerning new products with no historical sales data (Avogaro et al., 2025).
In order to remove these gaps, the hybrid B-SLR approach is chosen in the present study, based on the 10-step protocol formalised by Marzi et al. (2025), and the PRISMA 2020 indicators (Page et al., 2021). The investigation is directed by four research questions:
RQ1: What are the publication trends, citation patterns, sources, networks of author productivity, and networks of collaboration characterize the bibliometric landscape of a data-driven predictive analytics research topic in textile retail marketing during 2016-25?
RQ2: What does thematic architecture, intellectual structure, and evolutionary trajectory of the field appear to be based on patterns of keyword co-occurrence analysis, bibliographic connections between documents and a co-citation analysis of the referenced works using VOSviewer and Biblioshiny?
RQ3: What thematic groups, substantive learning, and methodological themes can be derived through a systematic synthesis of the 171-core textile-specific studies found in Phase 2?
RQ4: Which important research gaps and future research directions can be gained through combining the findings of the bibliometric performance, the results of science mapping and systematic review into a TCCM framework?
Theoretical Background
Predictive Analytics of Retail Marketing
Predictive analytics involves statistical algorithms, machine learning algorithms, and data mining to predict the future based on past and real-time data (Bradlow et al., 2017). Within the retail sector, analytics has advanced through three successive generations, namely, descriptive, predictive and prescriptive whereby the dominant one synthesises these paradigms using artificial intelligence and machine learning to support the instant, automated decision-making (Rooderkerk et al., 2023). This innovation empowers the retailers to go beyond simply knowing what has already happened and proactively predicting future shifts in consumer behaviour and the market to optimise many areas of their operations such as inventory management to personalised marketing programmes (Ghazal et al., 2025).
Analytical Context-specificity of the Textile Retail
Textile retail analytics and retail analytics, on the whole, have four main features, which deserve attention. To begin with, the purely visual nature of fashion requires computer vision and image analytics because every customer likes a particular colour, pattern, silhouette, or fabric texture that cannot be identified by transactional data alone (Liu et al., 2020; Sohn et al., 2020). Second, product lifecycles become shorter, which harms data accumulation and model training opportunities and makes real-time analytics an omnipresent fact. Third, the influence of opinion leaders, social media influencers, and other trend propagation via platforms creates an additional data ecosystem (Allal-Chérif et al., 2023; Arora et al., 2019; Xue et al., 2023). Fourth, the heightened sustainability demands introduce the aspect of the circle economy and ethical consumerism that has not been considered by traditional demand models (Huynh, 2022; Jain et al., 2018; Kayıkçı et al., 2022). This distinct analysis environment requires the use of a sophisticated predictive analytics technology that can handle high-dimensional unstructured data and dynamism in the business environment.
Theory Anchoring: SDL and Dynamic Capabilities
The presented review is based on two theoretical foundations, namely service-dominant logic (SDL; Vargo and Lusch, 2015) and the dynamic capabilities theory (Teece et al., 1997; Teece, 2018). SDL redefines value creation such that the focus lies on operant resources, that is, knowledge, skills and information systems (Vargo and Lusch, 2003). The SDL data and predictive analytics form a pair of operant resources that enable the value co-creation between firms and consumers; consumer behavioural data are probably the foundations of personalised recommendations, which, in turn, affect the purchase decisions and provide more data to be refined on an iterative basis (Blaschke et al., 2019). Dynamic capabilities theory builds SDL by explaining the organisational mechanisms of how firms create, combine, and restructure resources in response to the instability in the market (Seo et al., 2021). Predictive analytics in the context of textile retail is a higher-order dynamic capability that facilitate sensing, seizing and reconfiguring (Kumar et al., 2024) the ability to sense emerging fashion trends based on real-time social media analytics, to seize the opportunity by responding to demand fluctuations by reconfiguring inventory and production, and to a reconfigured supply chain in line with optimal responsiveness (Chowdhury et al., 2024). Predictive analytics application in the textile retail industry therefore plays a significant role in overcoming the dynamic nature of the industry where companies can now switch to proactive efforts rather than reactive ones due to heightened competition (Tran, 2025).
Combined, SDL and dynamic capabilities theory can offer the interpretive architecture which structures and lends sense to the four research questions that guide this review. The RQ1, mapping publication trends and patterns of author productivity, is based on the SDL assumption that knowledge and information systems are operant resources, the accumulation of which indicates the ability of the field to create value by co-creating value by researchers and retail professionals (Vargo and Lusch, 2015). RQ2, which analyzes the intellectual structure and thematic development of the field based on science mapping, is based on the dynamic capabilities theory and uses bibliographic coupling and co-citation clusters to explain how the research community has sensed, seized, and reconfigured its methodological repertoire in response to technological disruption - big data infrastructures in 2016-2019 to generative AI architectures in 2023-2025 (Teece et al., 1997; Teece, 2018).The third research question (RQ3) synthesising thematic clusters of the 171-article textile-specific corpus uses the value co-creation logic of SDL to comprehend how each cluster, personalisation systems to sustainability analytics, is a unique arrangement of data as operant resource implemented in service of consumer-firm interaction. The RQ4 that determines research gaps and builds the TCCM agenda is supported by the concept of dynamic capabilities theory, according to which sensing-seizing-reconfiguring capabilities need to be constantly renewed: the five priority gaps in Section 7 represent five domains of capabilities that the field in question has not yet developed adequately to maintain a competitive advantage at the firm level. This theoretical duality makes sure that the findings of the review are not just a descriptive list of published literature but that they are interpretively related to a given explanatory logic with respect to how firms develop, implement, and refresh data-driven resources within dynamic retail settings.
The B-SLR Approach and Bibliometric Foundations
The emerging literature review methodology, a hybrid bibliometric-systematic and formally defined 10-step protocol introduced by Marzi et al. (2025) and based on the presented guidelines of Donthu et al. (2021) and Lim et al. (2024), combines quantitative science mapping with qualitative thematic synthesis in order to achieve an all-encompassing, multi-layered analysis of Bibliometric methods provide an objective and scalable representation of intellectual networks, author-author networks, and theme trends on large-scale data sources, which reduces subjectivity of conventional reviews (Lim et al., 2024). Such a synergetic strategy uses bibliometrics to define intellectual architecture of the field and the systematic review to rigorously evaluate the knowledge frontier to break the bottlenecks of single methods by integrating breadth, objectivity, and depth (Marzi et al., 2025). Its usefulness and effectiveness is empirically proven in both high-impact management and marketing and interdisciplinary reviews (Goyal and Kumar, 2020), making it ideally placed to map dynamic, emerging areas of study such as data-driven predictive analytics in textile retail.
METHODOLOGY
Research Design
This study employed a hybrid bibliometric-systematic literature review, following the 10 steps described by Marzi et al. (2025). The research design was formulated into two stages, each addressing the four research questions. Phase 1 (addressing RQ1 and RQ2) carried out quantitative bibliometric analysis-both performance analysis and science mapping - of the entire deduplicated corpus of 553 articles. Phase 2 (addressing RQ3) built on this foundation by applying additional inclusion criteria to select 171 articles with retail as the major focus and textile as the sector of interest for intensive content analysis and thematic synthesis. Subsequent synthesis of findings from these two phases, combined with structural gaps identified by science mapping, addressed RQ4. The entire search, screening and selection process is represented by the PRISMA 2020 flow diagram (Page et al., 2021) shown as Figure 1. The PRISMA framework ensured the highest transparency and reproducibility, allowing other researchers to evaluate the validity of the study and its adequacy to the domain (Gazzola et al., 2024). In particular, the review was based on a hybrid methodological design that combined a formalized systematic literature review informed by the TCCM framework with bibliometric analysis, confirming that a systematic interrogation of the literature was performed through the examination of correspondence between research themes, theoretical frameworks, and research methods (Paul et al., 2021).
Diagram adapted from PRISMA 2020 (Page et al., 2021). Tools: Bibliometrix R v4.3.1 (Aria and Cuccurullo, 2017); VOSviewer v1.6.20 (van Eck and Waltman, 2010).
Summary: Scopus (419) + WoS (355)=774 → Duplicates removed (221) → Deduplicated corpus (553) | Phase 1 Bibliometric: n=553 | Phase 2 Systematic Review: n=171 | Integrated Findings.
Two reasons made it necessary to have the entire 553-record corpus and not just the 171 textile-specific studies for the bibliometric analysis in Phase 1. A large enough corpus (of 171 documents) is needed to maintain reliable co-occurrence and co-citation network structures, with a network too small to support stable modularity-based clustering. Second, keeping the larger body of retail-marketing literature enables a placement of the literature of textile/apparel in relation to the larger body of predictive-analytics-in-retail literature, a contribution of this study (see Section 5). The 171 studies are not an independently sampled corpus, but a nested subset of the 553 that were selected in Phase 2 with the inclusion criteria given in Section 3.3.
Database Selection and Search strategy
On 17 March 2026, Scopus and Web of Science Core Collection were searched to retrieve data (419 records from Scopus and 355 from Web of Science). Using two databases ensured comprehensive coverage and overcame single-database bias (Mongeon and Paul-Hus, 2015). The search query comprised three conceptual areas: analytics and technology terms; marketing function terms; and sector terms. These were combined with Boolean operators AND and OR to achieve a broad yet focused search of scholarly articles (Table 1) (Chowdhury et al., 2024).
| Item | Scopus | Web of Science Core Collection |
|---|---|---|
| Search Date | 17 March 2026 | 17 March 2026 |
| Search Field | TITLE-ABS-KEY | TS (Topic) |
| Search String | (TITLE-ABS-KEY ("predictive analytics" OR "data analytics" OR "machine learning" OR "artificial intelligence" OR "big data" OR "data mining" OR "deep learning" OR "data-driven") AND TITLE-ABS-KEY ("marketing" OR "consumer behavio*" OR "demand forecast*" OR "customer segment*" OR "personali*" OR "pricing" OR "retail analytics") AND TITLE-ABS-KEY ("textile*" OR "apparel" OR "fashion" OR "clothing" OR "garment*" OR "retail") | TS=(("predictive analytics" OR "data analytics" OR "machine learning" OR "artificial intelligence" OR "big data" OR "data mining" OR "deep learning" OR "data-driven") AND ("marketing" OR "consumer behavio*" OR "demand forecast*" OR "customer segment*" OR "personali*" OR "pricing" OR "retail analytics") AND ("textile*" OR "apparel" OR "fashion" OR "clothing" OR "garment*" OR "retail")) |
| Filters Applied | • Subject Area: Business, Management and Accounting (BUSI) • Document Type: Article (ar) • Language: English • Source Type: Journal (j) • Publication Year: 2016-2025 | • Document Type: Article • Language: English • Timespan: 2016-2025 |
| Records Retrieved | 419 | 355 |
| Deduplication Procedure | Imported into Bibliometrix R (v4.3.1). Deduplication performed using DOI as primary key + title + first author as secondary check. 221 duplicates removed. Final corpus=553 unique documents. | Same deduplication procedure applied to combined Scopus + WoS records |
PRISMA Screening and Study Selection
Bibliometrix R (v4.3.1; Aria and Cuccurullo, 2017) was used to deduplicate the articles automatically, resulting in 553 unique records in Phase 1 (a reduction of 221 due to duplication). In Phase 2, the titles and abstracts of the 553 records were independently screened by two reviewers against three inclusion criteria: (1) explicit use of predictive analytics, machine learning, artificial intelligence or big data techniques; (2) focus on marketing-related outcomes; and (3) take place in a textile, apparel, fashion, or clothes retail environment. The inter-rater reliability of title and abstract screening was measured with Cohen's Kappa statistic (Cohen, 1960). The Cohen κ was calculated at 0.87 which falls short of the almost perfect agreement set forth by Landis and Koch (1977) for Cohen κ values at or above 0.8. When disagreements were present it was resolved by discussion between the two reviewers until consensus was reached. Where there was continuing disagreement, a senior reviewer was consulted for arbitration.
A total of 377 records were discarded after the title and abstract screening. The rest of the articles were screened in full text, in which 5 more articles were excluded due to the non-compliance with the inclusion criteria on closer reading. This led to a final number of 171 studies which focused on textiles being used in the systematic content analysis and thematic synthesis stage. Inter-rater reliability was also very high for full-text screening (κ=0.94) and thematic cluster (κ=0.94).
Procedures of Bibliometrics Analysis: Performance Analysis (Phase 1 - RQ1)
The analysis of performance was done with Bibliometrix R v4.3.1 (Aria and Cuccurullo, 2017). This layer pertains directly to RQ1, quantifying productivity and impact of individual actors within the field: authors, journals, and countries. Namely, this discussed: yearly scientific output and time trends; citation formatting and document level effect; source allocation and the Law of scattering proposed by Bradford; author prolificacy and the Law of Lotka; and the national and international collaboration trends on scientific output. Collectively, these indicators determine the baseline of bibliometric performance of the field and contextualise the results of science mapping that are reported in Section 5.
Science Mapping (Phase 1 RQ2)
The direct application of RQ2 was carried out with the help of VOSviewer v1.6.20 (Van Eck and Waltman, 2010) and Biblioshiny R v4.3.1 to perform science mapping. Four complementary methods of analysis were implemented: (1) analysis of co-occurrence of author keywords (minimum frequency=5; full counting) and produced thematic groupings and conceptual proximities maps; (2) bibliographic coupling of documents (minimum citations=3), finding current research frontiers by shared reference lists; and (3) co-citation analysis of cited references (minimum co-citations=3), Fourth, thematic evolution was examined using time-slice keyword analysis in three time frames, including early emergence (2016-2019) and rapid growth (2020-2022) and contemporary consolidation (2023-2025). The interpretation was based on thematic clusters following from the sensemaking approach of Lim and Kumar (2023).
The systematic review and data extraction (Phase 2 - RQ3)
To ensure inter-coder reliability and uniformity, a standardised data extraction template was created and pilot-tested on a random subset of 20 articles. The extraction template recorded: country, industry segment, and dataset type as research context; theoretical framework employed; methodology of analysis (technique, algorithm, model architecture); marketing outcome variable; key findings; and author-stated limitations. All 171 articles were independently coded by two reviewers - one with a background in marketing analytics and one with a background in management (serving as research supervisor for the study) using the standardised data extraction template. Inter-coder reliability for thematic cluster assignment and data extraction was excellent (Cohen’s κ=0.94). Multiple coding was allowed if a theme was a major secondary contribution as well as a primary contribution. Discrepancies were resolved through discussion between the two authors; where consensus could not be reached, the final decision rested with the supervising author. The complete coding framework, including detailed inclusion rules, worked examples for each of the eight thematic clusters, is provided in Supplementary Table S1.
Performance Analysis (Addressing RQ1)
The bibliometric performance analysis of the merged Scopus-WoS corpus (n=553 articles, 2016-2025), produced by Biblioshiny R v4.3.1, is presented in this section. The performance analysis addressed RQ1 by quantifying publication trends, citation impact, source distribution, author productivity, and geographic collaboration networks across the ten-year development of the field.
Overview of the Corpus
The merged Scopus-Web of Science dataset comprised 553 peer-reviewed articles published between 2016 and 2025, drawn from 258 distinct journal sources. The average document age was 3.29 years, reflecting the recency bias characteristic of a field shaped by rapid advances in machine learning and retail digitalisation. The average citation age per document was 33.88 - favourable by management science standards - and the corpus as a whole contained 58,079 references, evidencing intensive cross-pollination among operations research, consumer behaviour, and data science. The 43.18% annual growth rate underscored the rapid expansion of this field, confirming that systematic mapping was not only useful but essential. The 1,634-strong author list, co-authorship ratio of 3.17 per paper, and international co-authorship rate of 24.41% indicated a collaborative, geographically dispersed field, even though the major research centres remained concentrated within a few countries.
Annual Scientific Production and Temporal Trajectory
The annual scientific production of the 553-article corpus showed significant and steady increase during the last decade (2016-2025). In 2016, the field started with a low volume of 7 articles and increased to 11 articles in 2017. The number of publications progressed gradually to 18 articles in 2018 and 24 articles in 2019. There was an obvious increase starting from 2020, when 39 articles were published and 57 articles in 2021. In 2022, the number of articles continues to grow at 72. In 2023, the number of articles was 57, followed by a significant spike to 91 articles in 2024. The most articles that were published were in 2025 (177 articles).
The study period was split into three phases for the purpose of examining the thematic evolution of the field. There were 60 articles in the emergence phase (2016-2019). The rapid growth phase (2020-2022) followed this, and added 168 articles. During the latest consolidation and acceleration process (2023-2025), 325 papers have been generated. The three phases, collectively, validate internal consistency of the annual publication data, making up the complete corpus of 553 articles.
The annual scientific output of the field shows a very good exponential trend from 2016 to 2025 (CAGR=43.18%). The volume of publications rose from 7 articles in 2016 to a high of 177 articles in 2025. Cumulative publication counts were fitted to a logistic growth model with the bibliometrix R package (Aria and Cuccurullo, 2017) to characterise the long-term growth trajectory. The model is of the usual logistic form:
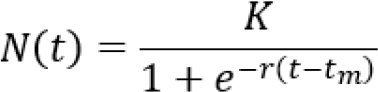
This equation has the variables: N(t) is the cumulative number of publications at time t (2016 is the base year), K is the carrying capacity (asymptotic maximum), $ r $ is the growth rate, and tm is the time at which the inflection point occurs.
The fitted model found that K ≈ 5,530 cumulative publications and year index 16.55 was the inflection point date. There was a good model fit (R²=0.907). The results show that the field is in its fast growth stage and not saturated yet. A projected carrying capacity of 10% was estimated to be attained around 2025 which corresponds to the observed increase in publications over the last few years.
Citation Structure and Impact
Mean citations per article exhibited a strong inverse relationship between recency and cumulative totals - an expected but analytically significant pattern. The corpus registered the highest average citation counts in 2020 (113.95 TC/article), attributable to the influential nature of that cohort's publications and the additional accumulation time those articles enjoyed. Citation-per-year normalised values for 2020 (16.28) also ranked highest across all cohorts, confirming 2020 as the most influential year on a time-adjusted basis. The 2016-2019 cohort demonstrated high raw citation means (52.61-63.43) but lower per-year rates, consistent with normal citation decay curves. The 2024-2025 cohort was comparatively small, though some 2025 articles had already accumulated citations at the time of analysis, indicating that recent work on generative AI and real-time pricing was attracting early scholarly attention.
Salinas et al. (2020, International Journal of Forecasting) with 2,004 citations was the most globally referenced article in the corpus - a remarkable figure that explained its visual dominance in the bibliographic coupling maps. Matarazzo et al. (2021, Journal of Business Research) ranked second with 723 citations, and Ma et al. (2020, International Journal of Research in Marketing) ranked third with 460 citations. Although Ferreira et al. (2016, Manufacturing and Service Operations Management) represented the oldest work in the earliest cohort, it held the highest citation count (369) and the highest normalised local citation score (6.53), establishing it as the foundational empirical reference for predictive inventory and markdown optimisation in this field. In the local ranking, Ferreira et al. (2016) had the most within-corpus citations (14), followed by De Bellis and Johar (2020) and Huber and Stuckenschmidt (2020) with 5 each - consistent with the bibliographic coupling results, where the same papers appeared as the most structurally coupled nodes.1
Source Distribution and Bradford’s Law
The distribution of sources in the field was examined using Bradford’s Law of scattering (Bradford, 1934). Bradford's Law is that there are a few small journals that contain a large percentage of the literature, and a lot of articles are also spread out in a few many journals. A total of 553 articles were published by 258 sources, which were split into three productive zones of roughly equal size.
Table 2 shows that in Zone 1 (core zone), there are just 20 journals which have published a total of 188 articles, accounting for 34.0% of the entire corpus. These leading journals are the most significant and prolific outlets in the area of data-driven predictive analytics in the field of textile retail marketing. The most popular journals are Journal of Retailing and Consumer Services (40 articles), Journal of Business Research (13 articles), and Expert Systems with Applications (12 articles).
| Zone | Number of Journals | Number of Articles | Percentage of Articles | Cumulative Articles |
|---|---|---|---|---|
| Zone 1 | 20 | 188 | 34.0% | 188 |
| Zone 2 | 66 | 184 | 33.3% | 372 |
| Zone 3 | 172 | 181 | 32.7% | 553 |
| Total | 258 | 553 | 100% | 553 |
Zone 2 has 66 journals with 184 articles (33.3%), and Zone 3 has 172 journals with 181 articles (32.7%). The three zones hence contain almost the same number of articles (188, 184 and 181), and this proves that the literature is presented according to Bradford's Law of scattering.
The zone-multiplier ratio is approximately 1: 3.3: 8.6 (20: 66: 172 journals). The geometric rise in the number of sources across zones and the relatively high proportion of articles in a relatively small number of “core” journals is the hallmark of Bradford's Law.
In addition to the number of publications, the impact of the cited publications was very different across the core Zone 1 journals. Table 3 shows the h-index, total citations and citations per article of the top ten cited sources in the corpus. Although not among the top 10 journals in terms of article volume, the International Journal of Forecasting had the highest citations-per-article ratio (371.0), largely due to the impact of Salinas et al. (2020) discussed in Section 4.3. The Journal of Retailing and Consumer Services, the most prolific, had the highest overall h-index (23), and the Journal of Business Research and Journal of Retailing had high impact per article (130.2 and 95.6 respectively), showing that the journals had an impact over a long period, but not on a small number of key articles.
| Rank | Source | Articles | Total Citations | Citations/Article | h-index |
|---|---|---|---|---|---|
| 1 | Journal of Retailing and Consumer Services | 40 | 1,817 | 45.4 | 23 |
| 2 | Journal of Business Research | 13 | 1,692 | 130.2 | 9 |
| 3 | Expert Systems with Applications | 12 | 401 | 33.4 | 8 |
| 4 | Journal of Retailing | 7 | 669 | 95.6 | 7 |
| 5 | Marketing Science | 9 | 487 | 54.1 | 7 |
| 6 | Technological Forecasting and Social Change | 7 | 461 | 65.9 | 7 |
| 7 | Annals of Operations Research | 6 | 228 | 38.0 | 6 |
| 8 | European Journal of Operational Research | 6 | 183 | 30.5 | 6 |
| 9 | International Journal of Forecasting | 6 | 2,226 | 371.0 | 6 |
| 10 | Manufacturing and Service Operations Management | 7 | 488 | 69.7 | 6 |
Note: Fractionalized articles account for co-authorship (an article with n authors contributes 1/n to each author’s fractional count). Source: Bibliometrix R, BiblioshinyReport-2026-03-17.xlsx.
Author Productivity and Lotka’s Law
Lotka's Law (Lotka, 1926) was applied to study the productivity of authors in this area of study, namely, data-driven predictive analytics in textile retail marketing. The analysis has been performed based on the entire corpus of 1,634 authors that has been brought together in 553 documents.
The distribution of the authors' contributions is extremely skewed. Of the 1,537 authors who published at all during the study period, 94.06% had a single paper published (Table 4). The other 80 authors (4.90%) had two papers each, 13 authors (0.80%) had three papers each, and only 4 authors (0.24%) had four papers. There were no authors with more than four papers in the corpus.
| Documents Written | Observed Number of Authors | Observed % | Expected (Theoretical) % | Expected Number of Authors* |
|---|---|---|---|---|
| 1 | 1,537 | 94.06% | 70.24% | 1,148 |
| 2 | 80 | 4.90% | 17.56% | 287 |
| 3 | 13 | 0.80% | 7.80% | 127 |
| 4 | 4 | 0.24% | 4.39% | 72 |
| Total | 1,634 | 100% | 100% | 1,634 |
The proportion of authors that publish 1 paper should theoretically be 70.24%, 17.56% for two papers, 7.80% for three papers, and 4.39% for four papers according to the classical Lotka’s inverse square law (where the proportion of authors publishing n papers is proportional to 1/n²). The expected frequencies are also given in Table 4.
The distribution of observed authors is significantly different from the theoretically expected distribution with a much larger fraction of single paper authors (94.06%) than theoretically would be expected (70.24%). This is a very significant deviation from the classical Lotka pattern, typical of new and interdisciplinary research areas. Occasional contributors, mostly from marketing, operations research, computer science, and fashion studies, participate in these, and a relatively small number of prolific researchers contribute several times.
In general, the high number of single-paper authors (94.06%) suggests that the research field is still in its growth and exploratory phase, similar to the high growth rate of 43.18% per year noted above.
Based on the widely used bibliometric approach, a Lotka exponent (β) was estimated by fitting a log-log ordinary least squares regression to the observed distribution of productivity Egghe, L. (2005). The fitted model showed a much more concentrated distribution of authors towards single-papers with β=4.31 (C=0.945, log-log R²=0.9999) than the classical Lotka model (1926) with β=2. A Kolmogorov-Smirnov (K-S) test was used to compare the observed and theoretical (β=2) cumulative distributions and showed that this deviation was statistically significant (D=0.238; critical value Dcrit=1.36/√ n=0.034 at α=0.05 with n=1,634 authors; D > Dcrit, p<0.001). This is the null hypothesis that the productivity of the authors in this field is distributed according to the classic Lotka distribution, which was rejected and which concurs with the findings of previous bibliometric studies that the productivity concentration in emerging and interdisciplinary fields is generally higher than that in mature fields Nicholls, P.T. (1989).
Country-Level Scientific Production and Collaboration
Geographic analysis of corresponding author affiliations identified China (n=72, 13.02%), USA (n=67, 12.12%), and India (n=57, 10.31%) as the three most productive national contributors to the corpus, collectively accounting for more than a third of total output. The United Kingdom (n=44, 7.96%) and Korea (n=23, 4.16%) followed in fourth and fifth positions, with Germany (n=19), Australia (n=12), Italy (n=11), Spain (n=11), and Canada (n=10) rounding out the top ten. By raw research contributions per country (including non-corresponding authors), the USA ranked first with 156 contributions, followed by India (127) and China (124) - a hierarchy closely mirroring the corresponding author data, indicating a high level of cross-border co-authorship in this field.
Citation impact by country produced a different ordering. German-affiliated work recorded the highest citation total (TC=2,691; average 141.6 per article), reflecting disproportionate contributions to the highest-impact work in algorithmic forecasting and causal inference. The USA followed with 2,491 total citations (average 37.2), India with 1,684 (average 29.5), and the UK with 1,652 (average 37.5). Italy, despite fewer raw articles, achieved an average of 86.9 citations per article - the second highest in the corpus - which may indicate that Italian contributions were concentrated in higher-impact subject areas, though this cannot be confirmed from citation counts alone. Multi-Country Publication (MCP) rates showed that the highest rates of internationally co-authored work were found in Malaysia (44.4%), France (42.9%), Australia (41.7%), and Spain (36.4%), consistent with strong interregional collaboration among mid-tier producing nations (Table 5).
| Rank | Country | Articles | Articles % | SCP | MCP | MCP % | Total TC | Citations/Article |
|---|---|---|---|---|---|---|---|---|
| 1 | China | 72 | 13.02% | 54 | 18 | 25.0% | 1,361 | 18.9 |
| 2 | USA | 67 | 12.12% | 56 | 11 | 16.4% | 2,491 | 37.2 |
| 3 | India | 57 | 10.31% | 50 | 7 | 12.3% | 1,684 | 29.5 |
| 4 | United Kingdom | 44 | 7.96% | 28 | 16 | 36.4% | 1,652 | 37.6 |
| 5 | Korea | 23 | 4.16% | 17 | 6 | 26.1% | 634 | 27.6 |
| 6 | Germany | 19 | 3.44% | 16 | 3 | 15.8% | 2,691 | 141.6 |
| 7 | Australia | 12 | 2.17% | 7 | 5 | 41.7% | 366 | 30.5 |
| 8 | Italy | 11 | 1.99% | 9 | 2 | 18.2% | 956 | 86.9 |
| 9 | Spain | 11 | 1.99% | 7 | 4 | 36.4% | 261 | 23.7 |
| 10 | Canada | 10 | 1.81% | 9 | 1 | 10.0% | 359 | 35.9 |
| 11 | Malaysia | 9 | 1.63% | 5 | 4 | 44.4% | 298 | 33.1 |
| 12 | Brazil | 8 | 1.45% | 6 | 2 | 25.0% | 269 | 33.6 |
Note: All citation counts were retrieved on 17 March 2026 using Biblioshiny R from the merged Scopus-WoS corpus and are subject to change. TC=Total Citations SCP=Single Country Publications; MCP=Multiple Country Publications. MCP % indicates the proportion of internationally co-authored papers for each country.
Analysis of Science Mapping (Addressing RQ2)
The analyses in this section are science mapping analyses to answer RQ2 using VOSviewer v1.6.20 and Biblioshiny R v4.3.1. Science mapping indelibly shows the two-way networking of actors and ideas in the discipline using three methods that are complementary: keyword co-occurrence, bibliographic coupling and co-citation analysis. They also intersect to triangulate the research space, as it currently exists, and its intellectual origin in the past one- an aspect that the B-SLR hybrid design necessitates credible bibliometric characterisation.
Overview of Science Mapping Strategy
Whereas performance analysis measured the productivity and influence of individual actors, science mapping is a visualisation that reveals the architecture of relationships among actors and ideas. The entire deduplicated corpus (n=553) was analysed using three complementary methods: keyword co-occurrence, which identified thematic clusters and conceptual proximities among research topics; bibliographic coupling, which grouped documents sharing common reference lists to identify research fronts and methodological affinities; and co-citation analysis of referenced works, which mapped the foundational literature around which the field has reconstructed its theoretical genealogy. The combination of these three methods triangulated both the present structure of the research space and its past intellectual foundations - an aspect that the B-SLR hybrid design required for credible and exhaustive bibliometric characterisation.
Co-occurrence Network Analysis of Keywords
The co-occurrence analysis was applied to author-supplied keywords across all 553 documents, generating a network of 75 nodes organised into several colour-coded clusters. The minimum keyword occurrence threshold was set at five - a compromise between network density and interpretability, consistent with Van Eck and Waltman's (Van Eck and Waltman, 2010) recommendations for mid-sized corpora. The resulting network map (Figure 3) revealed a well-structured, six-cluster topology with artificial intelligence (n=83) and machine learning (n=77) as the two dominant central nodes, whose high co-occurrence probability (10 shared documents) and central position confirmed their role as the defining constructs of the research domain.
The red cluster comprised keywords associated with AI-driven retail technologies, digital transformation, technology acceptance models, omnichannel retailing, personalisation, and consumer behaviour - representing the intersection of organisational adoption theory and data-based retail strategy. Marketing intelligence and analytics terminology formed the green cluster, encompassing customer segmentation, marketing analytics, retail analytics, marketing strategy, and text mining - consistent with the emerging use of unsupervised learning for consumer classification. The largest and most interconnected was the blue cluster, which brought together machine learning, artificial intelligence, consumer behaviour, digital marketing, social media, chatbots, augmented reality, and sustainability within one thematic domain - the modern frontier of AI-mediated consumer interaction research. The yellow-olive cluster contained data mining, pricing, forecasting, e-commerce, and information sharing - a logical sub-domain dealing with algorithmic decision support and operational pricing models. The orange cluster included social media analytics, fashion, influencer marketing, and Instagram, forming a stylistically distinct social commerce research community within the broader e-commerce studies field. Finally, the purple-teal core linked big data, e-commerce, retailing, retail operations, demand forecasting, and predictive analytics - the infrastructural and operational layer that historically defined this literature since its 2016 inception.
It should also be emphasized that these six conceptual clusters (derived from keyword co-occurrence) differ from the seven conceptual clusters derived from the co-citation analysis of cited references (see Section 5.6). While the six keyword, clusters show the thematic structure of the research topics, the co-citation clusters show the theoretical and methodological bases of the field.
Thematic Evolution across Three Periods
Dividing the corpus into three temporal periods - the emergence period (2016-2019, n=60), the rapid growth period (2020-2022, n=169), and the contemporary consolidation period (2023-2025, n=325) - enabled a more granular analysis of keyword evolution within the field.
The keywords that prevailed in the initial years (2016-2019) were big data (n=16), data mining (n=9), machine learning (n=7), and retailing (n=7). The term artificial intelligence made its first appearances in just five documents between the two years, indicating that it was yet to receive the definitive status it would gain afterwards. This was a phase of research that was largely infrastructural: researchers were demonstrating that big retail data could be effectively analysed with new computational techniques, and papers on markdown optimisation and early pricing algorithms established the paradigmatic template (Ferreira et al., 2016).
The field matured methodologically during the growth phase (2020-2022). Machine learning jumped to 27 appearances - nearly four times its early-period count - while artificial intelligence rose to 17, deep learning entered the vocabulary at 9, and demand forecasting, retail analytics, and e-commerce all cemented their roles. This period aligned with the Covid-19 disruption of physical retail and the resulting acceleration of AI implementation in inventory management, consumer sentiment analysis, and omnichannel demand prediction.
The 2023-2025 period was characterised by a clear shift (n=61) towards artificial intelligence as the dominant frame term, surpassing machine learning (n=43) in this most productive segment of the corpus. The most frequent co-thematic anchors were consumer behaviour (n=15), e-commerce (n=15), and pricing (n=13), indicating that methods demonstration had been replaced by applied behavioural modelling at scale. The emergence of chatbots, augmented reality, topic modelling, and digital marketing as newly active keywords was simultaneously validated, affirming that generative AI technologies and multimodal consumer engagement were reshaping the research agenda of the discipline (Table 6).
| Keyword | Phase 1: 2016-2019 (n=60) | Phase 2: 2020-2022 (n=169) | Phase 3: 2023-2025 (n=325) |
|---|---|---|---|
| Artificial intelligence | 5 | 17 | 61 ▲▲ |
| Machine learning | 7 | 27 ▲ | 43 ▲ |
| Big data | 16 ▲▲ | 19 | 7 ▼ |
| Data mining | 9 | 5 | 14 |
| E-commerce | 3 | 11 ▲ | 15 ▲ |
| Deep learning | 2 | 9 ▲ | 12 ▲ |
| Consumer behavior | 0 | 6 | 15 ▲▲ |
| Demand forecasting | 2 | 7 ▲ | 13 ▲ |
| Pricing | 4 | 2 | 13 ▲▲ |
| Retailing | 7 | 7 | 7 |
| Chatbots / AR / Topic modeling | 0 | 0-1 | 5-6 ▲▲ (new) |
▲=notable increase; ▲▲=dominant or newly emerged; ▼=relative decline. Source: Author keyword frequency by period, merged corpus (n=553).
Bibliographic Coupling of Documents
The analysis of bibliographic coupling was done on the entire corpus (n=553) at the level of individual document with two documents being considered coupled based on the common set of references cited by the articles. A minimum citation threshold of three instances per document was used to run the analysis, producing a network of 148 coupled documents in six colour-coded clusters (Figure 4). This threshold was chosen through trial and error: higher thresholds would yield overpopulated maps with little cluster resolution, whereas lower thresholds would exclude too many 2024-2025 documents whose citation accumulation was still in progress.
Salinas et al. (2020), International Journal of Forecasting) was the most structurally connected document in the network, occupying the largest node - expected given its position as the most globally cited paper in the corpus (2,004 total citations) and confirming that its N-BEATS deep learning forecasting architecture had become the technical benchmark against which demand forecasting contributions were evaluated. Ferreira et al. (2016), Manufacturing and Service Operations Management) was the second most structurally salient document, having laid the groundwork for a distinct cluster of markdown optimisation, inventory analytics, and data-based pricing - the sub-empirical domain of the field.
These six bibliographically coupled clusters were associated with the following research fronts. The green cluster, anchored by Salinas et al. (2020), Kourentzes and Athanasopoulos (2019), and Punia et al. (2020), grouped papers sharing reference overlap in probabilistic forecasting, neural time series models, and supply chain demand analytics. The red-pink cluster, which included Allal-Chérif et al. (2023), Kamoonpuri and Sengar (2023), Huynh (2022), and Feng et al. (2021), gathered AI adoption and chatbot research in retail services - an area that solidified rapidly from 2021 onwards. The supply chain intelligence and logistics analytics cluster occupied the orange-yellow area, anchored by Pasupuleti et al. (2024) (Kayıkçı et al., 2022), Ng et al. (2022), and Pascucci et al. (2022). The most expansive cluster, encompassing De Bellis and Johar (2020), Hänninen et al. (2018), Riegger et al. (2021), Weber (2019), Ma et al. (2020), and Schmidt et al. (2020), dealt with consumer AI acceptance, service robot adoption, omnichannel retail transformation, and personalisation - the behavioural and strategic heart of the literature. The purple group, anchored by Leippold et al. (2022) and Choi (2016), represented a specific thread of financial text analytics and fashion forecasting, disciplinarily distinct as indicated by its relative positioning in the coupling map.
Co-citation Analysis of Cited References
Co-citation analysis examined the intellectual background of the field by identifying which references were most commonly cited in conjunction with one another across the corpus's 58,079 reference entries. The co-citation of two works over time signified that the academic community regarded them as theoretically proximate - contributing to the same intellectual problem or methodological tradition. Cited references with at least three co-citations were analysed, using plain-text exports from Web of Science to ensure reliable reference parsing. The final network (Figure 5) contained 126 co-cited references, arranged in seven colour-coded clusters.
The most frequently co-cited reference was Verhoef et al. (n.d.) - 'Understanding customer experience throughout the customer journey' - which also occupied the largest node, placed at the centre of the most tightly connected cluster. This confirmed that customer experience theory remained the prevailing theoretical lens through which retail analytics research analysed its findings, regardless of whether a given paper was quantitative or qualitative in orientation. Davis et al. (1989) Technology Acceptance Model (TAM) aligned with Ajzen's Theory of Planned Behaviour and Nunkoo et al.'s work on consumer acceptance, forming the yellow-brown theoretical cluster on technology acceptance and adoption that underpinned the treatment of AI adoption by consumers and retailers.
The AI-in-marketing theoretical base comprised the red cluster, dominated by Bressgott et al. - 'How artificial intelligence will change the future of marketing' - alongside Bazaki et al. on chatbot design, Botti et al. on consumers and artificial intelligence, Martins et al., Flavián et al., and Osei-Frimpong. The most spatially and thematically distinct was the green cluster on the right side of the map, comprising the quantitative forecasting and statistical learning intellectual base: Breiman on Random Forests, Sadowski et al. on forecasting aggregation, Snyder et al. on forecasting with machine learning, Khandakar et al. on automatic time series, and Athanasopoulos et al. on forecast methods. The relative distance between this cluster and the consumer behaviour and AI adoption clusters was analytically significant: the most active research communities drew on substantially different reference bases, confirming the disciplinary bifurcation that carried direct implications for integration-oriented research agendas and for RQ4.
Integrative Synthesis: Intellectual Structure of the Field
A convergent reading across all three science mapping analyses - keyword co-occurrence, bibliographic coupling, and co-citation analysis - generated a coherent and internally consistent account of the intellectual structure of data-driven predictive analytics in textile retail marketing. The field was structured around two overlapping axes: a methodological axis running from big data and data mining through deep learning to generative AI, and a thematic axis moving from supply chain and inventory optimisation towards consumer behaviour and AI-mediated personalisation and social commerce. These axes converged at the central node of the keyword co-occurrence network - AI and machine learning - at the central node of the bibliographic coupling map (the Salinas-De Bellis-Hänninen core), and in the co-citation network anchored by the Verhoef-Breiman-Snyder cluster.
This convergent reading identified three structural gaps that directly informed Phase 2 of the review and the research agenda for RQ4. First, the co-citation map indicated a disciplinary divide between the demand forecasting reference cluster (Breiman, Snyder, Khandakar) and the consumer behaviour reference cluster (Verhoef, Davis, Ajzen) - two bodies of theory that seldom appeared together in the same papers, despite addressing complementary dimensions of retail decision-making. At the time of analysis, limited research had integrated predictive modelling techniques with behavioural consumer frameworks. Second, the temporal keyword analysis and temporal periodisation confirmed that sentiment analysis (mean year=2022.2), topic modelling (mean year=2024.3), and text analytics had entered the keyword vocabulary but remained theoretically ungrounded in the literature, indicating that NLP-based methods for consumer insight extraction were methodologically active but lacked theoretical anchoring. Third, the marginal position of sustainability, circular economy, and sustainable fashion across the keyword co-occurrence and co-citation networks confirmed that environmental and ethical aspects of AI-based retail analytics remained at the research frontier with little representation in mainstream predictive analytics models. All three gaps guided the thematic synthesis and conceptual framework development undertaken in Phase 2 and informed the subsequent RQ4 research agenda.
Findings of the Systematic Review (Addressing RQ3)
Phase 2 identified the 171 core studies that directly used predictive analytics to textile or apparel marketing results to produce eight thematic clusters using an inductive-deductive coding. Each paper was allowed to have multiple cluster assignments, and these assignments were 1.7 on average. This subtle method of categorizing allowed finding cross-cutting themes and interrelationships among the various applications of AI to the fashion industry (Bieńkowska, 2024).
In this sense, multiple thematic cluster assignments were allowed for papers because many of the papers in the corpus had more than one application domain, e.g., a paper on AI-driven virtual try-on system had both personalisation/recommendation (Cluster 2) and computer-vision based visual AI (Cluster 6). Excluding it from any single cluster would be a misrepresentation of its scope. There was no arbitrary limit on the number of clusters a paper could be counted for; a paper was only counted for a cluster given if it had content that substantively addressed the inclusion rule for that cluster (Table S1) and not tangentially or incidentally. This resulted in an average cluster assignment for 171-study corpus of 1.7 cluster assignments per paper. The percentages reported in Table 7 are therefore based on the 171 studies and are each meaningful, but not mutually exclusive - which is intentional and not a data error - and the percentages add up to more than 100%.
| Thematic Cluster | n | % | Sub-themes | Key Exemplars | Dominant Methods |
|---|---|---|---|---|---|
| 1. Consumer Behaviour and Sentiment Analytics | 68 | 39.8% | NLP/sentiment, purchase intention, ethical consumption | Liu et al. (2020); Arora et al. (2019); Xue et al. (2023) | NLP, Text Mining, SEM/PLS |
| 2. Personalization and Recommendation Systems | 58 | 33.9% | Collaborative filtering, visual rec., hyper-personalization, virtual try-on | Zhou et al. (2017); Micu et al. (2022); Sohn et al. (2020) | Deep Learning, Collaborative Filtering |
| 3. Social media and Digital Marketing | 46 | 26.9% | Influencer analytics, UGC trend detection, brand sentiment, TikTok/Instagram | Arora et al. (2019); Xue et al. (2023); Allal-Chérif et al. (2023) | NLP, SNA, Sentiment Analysis |
| 4. AI/ML Technology Adoption | 28 | 16.4% | Consumer TAM, chatbot adoption, retailer readiness, fsQCA | De Bellis & Johar (2020); Kamoonpuri & Sengar (2023) | SEM/PLS-SEM, Survey, fsQCA |
| 5. Demand Forecasting and Sales Prediction | 26 | 15.2% | LSTM/deep learning, cold-start, social media signals, ensemble methods | Ferreira et al. (2016); Punia et al. (2020a); Ban et al. (2018) | ML, LSTM, Time-Series, Regression Trees |
| 6. Visual AI and Fashion Design Intelligence | 26 | 15.2% | GANs for design, trend detection, computer vision, and fabric recognition | Sohn et al. (2020); Singh et al. (2020); Han et al. (2022) | Deep Learning, GAN, Computer Vision |
| 7. Sustainability and Ethical Fashion Analytics | 23 | 13.5% | Circular demand forecasting, traceability, ethical sourcing, waste reduction | Huynh (2022); Jain et al. (2018); Kayikci et al. (2022) | Mixed Methods, ML for Circular Models |
| 8. Luxury Fashion Analytics | 19 | 11.1% | Brand equity prediction, luxury consumption sentiment, digital luxury | Romão et al. (2018); Allal-Chérif et al. (2023) | SEM, NLP, Mixed Methods |
Note: Papers may span multiple clusters, following the inclusion rules in Table S1; percentages are of the 171-study base and sum to more than 100% by design (see paragraph above).
Consumer Behaviour and Sentiment Analytics (n=68, 39.8%)
This was the largest and fastest-growing cluster, with 68 papers (60 published between 2022 and 2025). This trend is observed as both the NLP technologies and the data concerning fashion-related social media are maturing, but it remains unclear whether there is a causal relationship between the two, because it is not possible to derive it from bibliometric numbers alone. Three predominant sub-streams were identified: fashion product review sentiment analysis, implemented with VADER, SVM, CNN-LSTM, and BERT; purchase intention prediction, based on browsing patterns, clickstream data, and social signal embeddings (with language model networks outperforming logistic regression for temporal relationship prediction); and ethical consumption analytics, employing social media to predict sustainability preferences. The cluster drew on the Theory of Planned Behaviour (Ajzen, 1991), the S-O-R model (Mehrabian and Russell, 1974), and consumer decision frameworks (Santos and Gonçalves, 2021). Furthermore, Ramos et al. (2023) found that ANNs were becoming more common to comprehend consumer behaviour patterns in the consumption of sustainable apparel and associated with the changing interest in the origin of purchased products and their traceability. The development of consumer-behaviour and sentiment analytics research (Section 6.1) is understood in the context of industry's stated need to cut down on high-trend turnover and move towards sustainable production, although this synthesis review does not show a direct link between these pressures and the research.
Personalisation and Recommendation Systems (n=58, 33.9%)
This cluster included AI-driven recommendation engines encompassing collaborative filtering systems and deep learning models incorporating visual features and body measurements. Four major sub-themes were identified: visual recommendations using computer vision (Sohn et al., 2020); hyper-personalisation with purchase history and contextual data (Micu et al., 2022); generative AI for virtual try-on (Wang et al., 2024); and cold-start problem solutions. Business-ready applications in the fashion industry included StyleSnap by Amazon (Du et al., 2022) and the outfit compatibility graph at Zalando (Celikik et al., 2022). A common application was the use of machine learning algorithms to support personalised recommendation systems, treating consumer behaviour as a predictor of purchase intent (Goti et al., 2023). These systems were powered by collaborative and content-based filtering combined with deep learning, employing advanced algorithms to make personalised fashion recommendations based on detailed analyses of user behaviour and preferences (Giovanola et al., 2024). More sophisticated models employed Convolutional Neural Networks such as ResNet50 and VGG16, processing visual features from fashion images to identify finer consumer preferences regarding specific textures and patterns (Carion et al., 2020).
Social Media and Digital Marketing Analytics (n=46, 26.9%)
Of the 46 papers in this cluster, 39 have been published since 2021, reflecting the increasing body of research on social media as a data source and a marketing channel for fashion brands over the last few years. Four important sub-themes emerged: measurement of influencer marketing effectiveness; social media-based demand forecasting using LDA and real-time NLP; brand sentiment measurement through User-Generated Content (UGC); and trend pattern identification from UGC. Key exemplars included Arora et al., who developed a multi-platform social media influence index (Arora et al., 2019), and Allal-Chérif et al., who demonstrated that AI-based virtual influencers could outperform human influencers on certain engagement metrics (Allal-Chérif et al., 2023). One study in this cluster, by Yeo et al. (2022), identified the benefits of implementing strategic AI in social media marketing: optimizing ad placement, enhancing targeting accuracy, and dynamically adjusting campaigns according to new trends in influencers.
AI/ML Technology Adoption (n=28, 16.4%)
This cluster examined how consumers and retailers adopted AI-powered fashion technologies, drawing on technology acceptance theories. Kamoonpuri and Sengar (2023) demonstrated that perceived anthropomorphism and social presence had a strong effect on consumer trust in AI fashion assistants, while De Bellis and Johar (2020) found that the desire for control moderated the acceptance of AI-facilitated purchase decisions. The cluster was dominated by TAM (Davis, 1989), although UTAUT2 (Venkatesh et al., 2012) also suited in fashion scenarios by capturing hedonic motivation and habit. Additionally, the introduction of AI into the fashion retail sector was found to require reviewing organisational preparedness in terms of infrastructure, data management, and workforce re-skilling (Adigwe et al., 2024; Jung, 2025).
Demand Provision and Sales Anticipation (n=26, 15.2%)
This cluster addressed the forecasting intellectual pillar directly. Three major directions were identified: comparing machine learning with classical techniques, demonstrating that LSTM outperformed ARIMA (Punia et al., 2020; Spiliotis et al., 2022) and that ensemble methods achieved superior accuracy; solving the cold-start problem for new fashion products with no sales history (Ferreira et al., 2016); and proactive demand sensing from social media and digital signals. Goodwin et al. (2023) reported 15-30% reductions in inventory waste when ensemble machine learning models replaced classical ARIMA-based frameworks in their study setting. Fu and Fisher (2023) found that ADI and AIT usage in demand forecasting supported more effective inventory use, reducing excess production and stockouts in a fashion retail setting characterised by short product life cycles. Such proactive demand forecasting was especially important for new fashion products, where conventional forecasting tools performed poorly due to scarce historical data and rapidly shifting consumer tastes (Anitha and Neelakandan, 2024). The inherent unpredictability of the fashion industry - short selling seasons, lumpy demand, and limited historical data - made demand forecasting particularly challenging (Swaminathan and Venkitasubramony, 2023).
Visual AI and Fashion Design Intelligence (n=26, 15.2%)
This cluster centred on deep learning and computer vision techniques. Three key streams were identified: automatic forecasting of social media trends and images using CNNs (Han et al., 2022); style classification using transfer learning approaches (Sohn et al., 2020); and generative design using GANs and diffusion models (Singh et al., 2020). Importantly, GANs enabled virtual garment simulation, reducing reliance on physical prototypes and substantially cutting material waste (Ghori et al., 2025). This technology enabled designers to accelerate design iteration (Lee et al., 2025), anticipate consumer acceptance (Papadopoulos et al., 2022), and streamline manufacturing by minimising the need for physical samples (Ghori et al., 2025). Furthermore, visual AI enabled the identification of essential product attributes driving consumer preferences by quantifying their impact through metrics such as 'influence scores', providing objective recommendations for design decisions and marketing strategy (Li and Du, 2024).
Sustainability and Ethical Fashion Analytics (n=23, 13.5%)
Among the 23 articles in this cluster, 20 were published after 2021, reflecting a recent focus on the research area of sustainability requirements and AI capabilities. Three core streams were identified: circular economy analytics using AI (Huynh, 2022); AI-enhanced supply chain transparency through blockchain and NLP (Kayıkçı et al., 2022); and reduction of textile waste through improved demand accuracy (Younus, 2024). The thematic evolution map (Section 5.3) shows this cluster advancing to niche/motor theme status over the review period. AI-enabled demand forecasting was shown to reduce unsold inventory, which (Papadopoulos et al., 2022) identify as a major driver of environmental impact in the fashion industry. Generative AI applications were found to generate virtual samples, eliminating the need for physical prototypes and substantially reducing textile waste in pre-consumer stages (Ghori et al., 2025).
Luxury Fashion Analytics (n=19, 11.1%)
This cluster examined predictive analytics applied to brand equity, premium segmentation, and luxury consumption sentiment. Allal-Chérif et al. (2023) demonstrated that AI-driven virtual influencers could outperform human influencers on luxury brand engagement metrics. This approach was applied to hyper-personalising luxury marketing, with AI analysing individual consumer data to deliver customised product suggestions and experiences that reinforced brand loyalty and the sense of exclusivity (Cenizo, 2025).
Methodological Landscape
The 171 studies are heterogeneous in terms of methodology, with the largest category of the mixed and other methods. It is then succeeded by qualitative and case studies, deep learning and machine learning methods, NLP and text mining, and survey. It is important to note that only 4 studies use longitudinal field experiments. The resulting sparsity suggests a chance to further empirical studies that are more rigorous and long-term, in establishing AI applications in the complex and dynamic world of fashion.
Research Gaps and Future Research Agenda (Addressing RQ4)
Based on the convergent evidence of performance analysis (Section 4), science mapping (Section 5) and systematic review findings (Section 6), five research gaps of priority are identified and organized in terms of Theory, Context, Characteristics, Methodology (TCCM). These gaps are those that beget the analysis of bibliometric structures and these are the most impactful issues that remain unanswered in the field.
Gap 1: Theory - The Forecasting-Consumer Behaviour Integration Deficit
A structural bifurcation between the consumer behaviour reference cluster (anchored by Verhoef, Davis, Ajzen) and the demand forecasting reference cluster (anchored by Breiman, Snyder, Khandakar) can be seen through a series of co-citation clusters (section 5.5). The two intellectual community groups are hardly ever seen in the same papers, although they are concerned with complementary aspects of retail decision-making. The next generation of research must provide integrative theories that combine SDL and dynamic capabilities theory with the forecasting approach to define theoretically based models of the way in which the AI-generated demand forecasting can be converted into selling activities and customer performance. It would be especially useful to consider longitudinal (using multi-method) designs that would combine the forecasting experiments with consumer panel surveys.
Gap 2: Context - Developing Economy and Cooperative Retail Neglect
The geographic analysis (Section 4.6), demonstrates that China, USA and India are the sources of more than 35% of the corresponding author output of the corpus, but within-country analysis indicates that MSME retail sector,cooperative retail structures cooperative retail structures, handloom sectors as well as government-run textile programmes of developing economies are systematically excluded in the literature reviewed. The overlay search operation validates that the peripheral areas (sustainability, circular economy, influencer marketing) meet the requirement of having publication dates no earlier than 2022 and none of them are cooperative or non-commercial retail environments. Future studies are to discuss the implementation of predictive analytics frameworks, worked out in fast-fashion and e-commerce settings, to cooperative and heritage textile retail infrastructure, where competitive processes, data infrastructure, and digital literacy vary significantly.
Gap 3: Characteristics- NLP and Sentiment Analytics Without Theoretical Grounding
Sentiment analysis (mean year ≈ 2022.2) and topic modeling (mean year ≈ 2024.3) have already reached the contemporary frontier of the corpus in the keyword vocabulary but have yet to form a tightly-knit bibliographic network. This is supported by systematic review data (Section 6.2): NLP-based papers represent 18 articles (Cluster 1) using explicit consumer behaviour theory in less than 20% of the studies. Lack of theoretical basis in this methodological exercise is a weakness. Further studies in the area of NLP-based consumer sentiment measurement should contextualize the results of aspect-based sentiment analysis with an already existing adoption/experience model; that is, facets of perceived usefulness, trust, and service quality.
Gap 4: Characteristics - Sustainability and Ethical AI Integration
The network map (Section 5.2) helps identify that the sustainability, circular economy, and sustainable fashion continue to be situated in the cold-blue section of the map although their significance in the industry has been recorded (Huynh, 2022; Kayıkçı et al., 2022). Analysis of systematic review indicates that only 12 articles (Cluster 6) extensively cover environmental or ethical aspect. Future studies ought to analyse how predictive analytics models may be aimed at maximising sustainability performance - such as reduction of overstock, forecasting carbon footprint, and ethical supply chain visibility - besides the traditional commercial goals. Operant resource framing of SDL provides a very fruitful theoretical point of entry to conceptualisation of the sustainability data as a resource of co-creation.
Gap 5: Methodology - Generative AI and Multimodal Analytics
The keyword temporal evolution analysis (Section 5.3) confirms that chatbots (mean year ≈ 2024.4), augmented reality (mean year ≈ 2024.2), and topic modeling (mean year ≈ 2024.3) are all more recently added keywords in the corpus that are added in the generative AI wave (i.e., post 2022). Such technologies have not provided multi-ply intra-cluster bibliographic ties indicating methodological action without unified research design practices. Future studies ought to produce rigorous experimental and quasi-experimental models of testing generative AI applications in textile retail marketing, such as the use of generative AI to identify demand signals, multiple-modal product recommendation systems through the integration of both visual and textual consumer data, and detecting trends in real time through generative AI-enhanced social media analytics pipelines.
DISCUSSION
This paper presented the hybrid bibliometric-systematic literature review focused on data-driven predictive analytics in textile retail marketing, synthesising 553 peer-reviewed articles published since 2016. The four-question research design enabled a systematic progression from bibliometric performance benchmarking (RQ1) to intellectual structure mapping (RQ2), thematic synthesis (RQ3), and a theory-contextualised future research agenda (RQ4).
Using a performance analysis, sustained exponential growth was found (CAGR=43.18%) and logistic modelling projected that the field is still in an accelerated growth phase and should reach an inflection point in around 2031. Bradford's Law analysis established the Journal of Retailing and Consumer Services as the dominant publication outlet, while the deviation from Lotka's theoretical predictions (observed 94.1% vs. expected 70.2% single-publication authors) was indicative of high disciplinary fragmentation. The citation leadership of Germany and the consistent top-three productivity of India represent strategically relevant findings for journal editors and research funding institutions.
Science mapping (RQ2) showed a field organised around two overlapping axes - methodological (big data → ML → deep learning → generative AI) and thematic (supply chain → consumer behaviour → AI-mediated personalisation) - which intersected to form the intellectual centre of gravity. The most significant co-citation finding was the disciplinary dichotomy between the demand forecasting reference cluster and the consumer behaviour reference cluster: a structural divide with immediate theoretical consequences. Keyword temporal evolution analysis supported the finding that AI had displaced machine learning as the dominant frame term of the field, indicative of how the literature had transformed to reflect the generative AI wave.
The systematic review (RQ3) integrated 171 textile-specific articles into eight thematic clusters, confirming the dominance of deep learning architectures in both forecasting and NLP applications, and identifying the lack of theoretical grounding in NLP-based consumer analytics as the most notable methodological gap. These convergent findings were then translated into five prioritised gaps within a TCCM-structured research agenda (RQ4) encompassing theoretical integration, geographic contextualisation, NLP theory-building, sustainability operationalisation, and generative AI methodology development.
Implications for Practice
This hybrid B-SLR results in actionable insights for textile and apparel retail practitioners. To improve demand sensing and minimize waste in inventory, retail strategists and analytics leaders should focus more on deep learning and generative AI architectures rather than on classic big data techniques, such as those for probabilistic forecasting or integrating live social media. When it comes to hyper-personalization, virtual try-on systems, and optimizing influencer campaigns, that's where NLP-based sentiment analytics and visual AI technologies could come in handy for marketing managers, as these aspects have emerged at the forefront of the literature with their growth and influence. Business leaders in the supply chain must ensure that predictive analytics becomes part and parcel of sustainability goals, leveraging AI for circular economy ventures, waste reduction, and transparency in ethical sourcing. Lastly, companies need to overcome the discipline divide by enabling cross-functional cooperation between analytics, marketing and operations to fully capitalize on the value of the predictive analytics investments.
LIMITATIONS
Only the English-language publications indexed in Scopus and Web of Science are used in this review, which may have a negative impact on the presence of regional databases and non-Western researchers. The above-mentioned 2016-2025 period reflects the development with in recent years but excludes the earlier underlying research. In Phase 2, multi-cluster assignments included some subjectivity, which was addressed by the use of dual-reviewer coding and high levels of inter-coder reliability. Lastly, the speed at which generative AI innovations are progressing implies that some of the innovations in this field by 2025-2026 are unlikely to be reflected entirely in the indexed corpus. Even future studies must go over and beyond the traditional bibliometric methodology through the use of real-time streams of data and the application of up-and-coming AI technologies to factor in the latest trends and their impact on the textile, apparel, and fashion sectors (Dharma et al., 2025). Long-term effects of AI and smart systems regarding operational efficiency, sustainability, and waste elimination in these industries should also be studied in the context of longitudinal studies (Abbate et al., 2023; Carvalho et al., 2025). Furthermore, the idea of data analytics and its use in developing sustainable practices in the textile sector and waste management and the concepts of a circular economy should be explored more deeply (Ekwezia et al., 2023).
CONCLUSION
This study is a valuable contribution to scientometric research in a number of regards. Firstly, it contributes to the scientometric literature by showing the applicability of the B-SLR protocol in an interdisciplinary technology-driven field. Secondly, it provides an applied example of the synergistic power of the combination of the performance analysis, keyword co-occurrence, bibliographic coupling, co-citation analysis and PRISMA-guided systematic review in a replicable methodological template for future hybrid reviews.
Third, the triangulation by method indicated that thematic clusters and deeper structural forms regarding the demarcation of the disciplinary standpoints between the foundations of demand forecasting and consumer behaviour were uncovered. This shows the capacity of science mapping techniques to expose gaps in the integration of theories which are otherwise not evident in only one-method studies. Last, use of the TCCM framework to bibliometric findings illustrates the application of scientometric products to create future research agendas in new fields of digitalization and innovation.
ABBREVIATIONS
- AI
- Artificial Intelligence
- ARIMA
- Autoregressive Integrated Moving Average
- B-SLR
- Bibliometric-Systematic Literature Review
- CAGR
- Compound Annual Growth Rate
- CNN
- Convolutional Neural Network
- fsQCA
- Fuzzy-Set Qualitative Comparative Analysis
- GAN
- Generative Adversarial Network
- LSTM
- Long Short-Term Memory
- ML
- Machine Learning
- NLP
- Natural Language Processing
- PLS
- Partial Least Squares
- PRISMA
- Preferred Reporting Items for Systematic Reviews and Meta-Analyses
- SDL
- Service-Dominant Logic
- SEM
- Structural Equation Modelling
- TAM
- Technology Acceptance Model
- TCCM
- Theory, Context, Characteristics, Methodology
- UTAUT2
- Unified Theory of Acceptance and Use of Technology 2.
CONFLICT OF INTEREST
The authors declare that there is no conflict of interest.
FUNDING
No particular grant was given to this research by any funder.
DATA AVAILABILITY
The entire merged corpus (n=553), Phase 2 coding template and VOSviewer map files can be obtained by the corresponding author upon reasonable request.
Notes
1 Note: All citation counts were retrieved on 17 March 2026 using Biblioshiny R from the merged Scopus-WoS corpus and are subject to change.