0% READ
FULL TEXT
INTRODUCTION
The Persistence of Individual Authorship in Collaborative Science
Authorship in academia is traditionally viewed as a form of strategic cooperation based on mutual trust, idea exchange, and stable collaborations. The collective integration of efforts, coauthorship accelerates the production of scientific knowledge, increases citation rates, strengthens researchers’ reputations, and provides access to new resources. It is not surprising that, as early as the second half of the twentieth century, many scholars predicted the imminent decline of individual science and the triumph of collective work. Derek de Solla Price, in his book Little Science, Big Science (Price, 1963), forecasted that by 1980 single-author publications would completely disappear. Today, more than sixty years later, the growth of team publications is indeed observed across many disciplines, particularly in the natural and quantitative sciences, which require the coordination of multiple international laboratories. This trend is especially pronounced in leading research centers, including top U.S. universities (Wuchty et al., 2007).
Nevertheless, despite the steady increase in the average number of coauthors per paper (Adams et al., 2005), the share of single-authored publications remains substantial. This share is particularly high in the humanities and in theoretical disciplines, where individual contributions continue to play a central role. As noted by Leahey (Leahey, 2016), the collectivization of science is not a universal process: solo authorship remains prevalent in fields that do not depend on extensive infrastructure, costly equipment, or large research teams, and where scholarly value is determined primarily by originality of ideas and individual intellectual style. Thus, a paradox of modern science emerges despite the proclaimed superiority of collaboration, a considerable proportion of scholars continue to pursue autonomous strategies.
Ethical Dimensions and Informal Practices
Alongside this reluctance to collaborate at all, a growing body of evidence suggests that even where collaboration does occur, it rarely conforms to the idealized model of equitable, trust-based exchange - the structure of coauthorship itself bears the marks of strategic behavior. Empirical evidence increasingly reveals a gap between officially declared ethical principles and actual practices in academic collaboration. Scientific cooperation is embedded in social and economic contexts shaped by competition for limited resources- grants, positions, and recognition (Stephan, 2012; Edwards and Roy, 2017) as well as by strong incentives for career advancement and the accumulation of scientific capital, such as citation-based metrics (Moher et al., 2020). These pressures have intensified alongside rising productivity demands.
Extreme manifestations of such pressures have been documented in rapidly expanding research systems. For example, investigative reporting from China has revealed large-scale authorship falsification networks involving thousands of journals and substantial financial turnover (Luo and Wang, 2024). More broadly, analytical studies indicate that inappropriate authorship practices are widespread across disciplines and countries. Estimates suggest that ghost authorship affects 10-50% of publications (Cronin et al., 2003; Marušić et al., 2011; Stretton et al., 2012; Stretton, 2014), while guest or honorary authorship remains particularly prevalent in biomedical fields, sometimes reaching very high levels (Gøtzsche et al., 2007; Bosch and Esfandiari, 2021).
These findings challenge the idealized view of coauthorship as a purely ethical and norm-governed practice. Like other competitive domains, academic collaboration is subject to strategic behavior and, at times, deception (Smaldino and McElreath, 2016; Grossmann, 2020). From an evolutionary perspective, this demystification is not exceptional: complex social phenomena-from mate choice and kin altruism to parental investment-have long been successfully analyzed as strategic adaptations using evolutionary theory and agent-based models (Hamilton, 1964; Trivers, 1972; Buss, 2015; Semenova et al., 2023). Academic cooperation can be examined within the same analytical framework (Grossmann, 2020; Akbaritabar et al., 2021).
Importantly, strategic behavior in coauthorship does not necessarily imply overt misconduct. Even ethically sound and productive collaborations involve strategic rationality and exchanges of scientific capital (Bourdieu, 1975; Cronin, 2001). Division of labor within research teams-allocation of analytical, writing, or managerial tasks-often reflects not only expertise but also investments in reputation, access to resources, and influence within the scientific field (Guetzkow et al., 2004; Laudel, 2001).
While such organization can enhance collective efficiency (“collaborative intelligence”; Wuchty et al., 2007), it also creates opportunities for hidden transactions, including informal obligations, hierarchical reinforcement (e.g., authorship order conventions), and systematic undervaluation of organizational or managerial contributions relative to intellectual (Liu and Fang, 2012; O’Brien et al., 2015). This coexistence of cooperative benefits and strategic vulnerability makes academic coauthorship a particularly informative “natural laboratory” (Fehr and Leibbrandt, 2011) for studying how cooperation persists under incentives for partial defection, how trust networks are maintained, and how institutional norms evolve in response to individual strategic behavior (Smaldino and McElreath, 2016; Petersen et al., 2014).
Game Theory and the Problem of Cooperation: Theoretical Tensions
To understand the reasons behind these patterns, it is useful to turn to game theory, which studies strategies of cooperation but also faces limitations in its predictions. This interdisciplinary field, situated at the intersection of social, biological, and mathematical sciences, was initially considered a promising tool for analyzing the dynamics of interactions in multi-agent systems. However, over the past decades, it has struggled with discrepancies between model forecasts and empirical observations. Numerous experimental studies of social dilemmas - from the classical Prisoner’s Dilemma (Axelrod, 1984) and the Chain Store Game (Selten, 1978) to the Hawk-Do 1t is widely believed ve (Maynard Smith and Price, 1973) and Snowdrift (Hauert and Doebeli, 2004) games, including their iterated forms - have repeatedly demonstrated a fundamental gap between theoretical predictions and actual human behavior (Camerer, 2003; Rand and Nowak, 2013; Bear and Rand, 2016). Predictions based on replicator dynamics and other analytical models, which assume that Nash equilibrium is the inevitable outcome of rational optimization (Samuelson, 1997; Selten, 1978; Young, 1998), have consistently diverged from empirical findings, especially in laboratory settings with low stakes (Camerer and Hogarth, 1999; Exadaktylos et al., 2013). Participants in experiments often displayed behavior that appeared “irrational” from the perspective of classical theory - for example, a tendency toward cooperation in situations where defection was expected to dominate according to Nash equilibrium. This discrepancy has called into question the universality of mathematical predictions in strategic situations (Rand et al., 2012; Bear and Rand, 2016).
It is widely believed that human decisions are more strongly driven by trust (Apicella et al., 2012), intuition, emotional responses (Gigerenzer et al., 2011), or social norms (Capraro and Rand, 2018) than by the calculation of expected utility. In an attempt to capture these factors, models of cooperation in recent decades have incorporated additional variables - such as reputation, memory, network structure, information asymmetry, and sanctions - which have greatly increased model complexity. However, in new contexts, these games often became entirely unpredictable and lost their basic universality, raising questions about their falsifiability and actual explanatory power (Hilbe and Schmid, 2021). Thus, the path of complicating models to explain “irrational” behavior created a profound methodological paradox (Hilbe and Schmid, 2021): while early “simple” models were criticized for assuming unrealistically precise calculations of payoffs in basic interactions (e.g., in a one-shot Prisoner’s Dilemma), newer, extended models effectively require agents to possess even more advanced cognitive abilities (Zollman, 2021). This casts doubt on the very possibility of adequately modeling human cooperation within such overly complex paradigms (Bear and Rand, 2016; Leahey, 2006).
Academic Coauthorship as a High-Stakes Strategic Game
Instead of continually complicating models to explain behavior in laboratory games with low stakes, one productive approach is to radically shift the focus toward gaming environments where payoffs are genuinely equivalent to fitness, that is, where they have direct and long-term consequences for survival, reproductive success, economic security, or social status (Nettle et al., 2013). It is precisely in high-stakes gaming contexts that game theory could be closest to its evolutionary prototype (Maynard Smith and Price, 1973; Hammerstein, 2003), thereby demonstrating its highest predictive power, since agents are forced to act strategically to maximize fitness under real risk (Apicella et al., 2012; Gurven, 2004). In sharp contrast, the vast majority of laboratory games typically operate with “stakes” that do not exceed a few hours’ wages (Camerer and Hogarth, 1999; Exadaktylos et al., 2013). Although such sums may be subjectively significant in a short-term experiment, they rarely involve existential losses or open life-changing opportunities (Henrich et al., 2010). Consequently, they fail to create the necessary incentives or cognitive engagement for players to act fully strategically, relying on a deep calculation of consequences (Cala et al., 2022; Kiyonari et al., 2000). This fundamentally limits the applicability of results from such artificial games to long-term social interactions in the real world, where decisions have far-reaching, life-critical consequences for all agents (Fehr and Leibbrandt, 2011).
Academic coauthorship closely fits the conditions of high-stakes interaction. The outcomes of collaborative work are permanently recorded in bibliographic databases and directly shape career trajectories and scientific influence. At the same time, publication opportunities for individual researchers are structurally limited: each article represents a scarce “slot” whose allocation affects professional status and access to resources.
Producing a scientific article is labor-intensive and often extends over months or years (SITA Publishing, 2026; Luo and Wang, 2024; Publons, 2018). Individual publication output varies substantially across disciplines and demographic groups (Leahey 2006; Abramo et al., 2024; National Science Foundation, 2022). In many academic systems, formalized bibliometric evaluation links career advancement to quantitative publication indicators (González et al., 2012; Marzolla, 2015; University of Missouri, 2020; Wang et al., 2023). For instance, research universities in the USA and Canada commonly expect faculty members to produce at least two papers per year in high-ranking journals (University of Missouri, 2020) - a widely used institutional benchmark that we later adopt as the baseline productivity parameter in our agent-based model (see Section 2.3.2). Although such systems often stimulate measured productivity growth (Akbaritabar et al., 2021), substantial proportions of researchers remain marginal in indexed publication channels.
An additional source of high stakes is the limited duration of active scientific careers. Research productivity typically spans no more than 30-35 years, with peak output in mid-career followed by plateau or decline (Jones, 2010; Jones and Weinberg, 2011). As a result, each researcher disposes of a finite and non-renewable authorship resource. In the empirical dataset used in this study (eLidrary indexed papers), the average number of publications per author is approximately 20, underscoring the strictness of this constraint.
Under such conditions, including additional coauthors, especially without guaranteed reciprocity or proportional contribution - becomes a strategic decision. It effectively reallocates part of one’s limited “fitness” to potential competitors for positions, grants, and recognition (Wuchty et al., 2007; Sekara et al., 2018). Empirical studies indicate that a substantial share of scientific collaborations fail due to conflict and exploitation (Kale et al., 2002; Smith et al., 2020). Academic coauthorship thus functions as a high-stakes “natural laboratory” (Fehr and Leibbrandt, 2011; Smaldino and McElreath, 2016) in which decisions about cooperation or exclusion directly affect productivity, career advancement, and the accumulation of reputational capital (Li et al., 2019; Petersen et al., 2012).
Despite these features, coauthorship decisions are rarely modelled as a multilevel strategic process, in which individual choices aggregate - through an explicit population-level evolutionary dynamic - into organization-level authorship distributions. One reason may be the normative framing of cooperation as an academic virtue associated with fairness and integrity (Merton, 1973; Hackett, 2005). Yet practices such as ghost and guest authorship reveal that coauthorship also contains strategic and competitive dimensions that can undermine epistemic trust (Biagioli, 2022; Shamoo and Resnik, 2009; International Committee of Medical Journal Editors [ICMJE, 2026], Gøtzsche et al., 2007). This gap between normative framing and strategic reality is mirrored in the literature itself: existing models of authorship dynamics fall into two largely disconnected traditions. Game-theoretic and analytical models formalise individual-level incentives for strategic authorship - including credit allocation, honorary authorship, and order of names - but are rarely calibrated to large-scale publication data (Engers et al., 1999; Ozerturk and Yildirim, 2025; Lazebnik et al., 2023; Shen and Barabási, 2014; Yildirim, 2023). Descriptive and bibliometric studies on the other hand document organisational authorship patterns - team size (Cook et al., 2015; Kenna and Berche, 2012), contributorship (Akbaritabar et al., 2018; Larivière et al., 2016; Sauermann and Haeussler, 2017), and institutional composition (Fortunato et al., 2018; Wuchty et al., 2007) - yet do not specify the evolutionary dynamics through which individual strategic choices aggregate into those patterns.
This reliance on game-theoretic reasoning, in turn, speaks to a longer-standing methodological debate over whether strategic behavior should be modeled as payoff-maximizing at all. In evolutionary biology, optimality models have been criticized for assuming, rather than testing, that observed traits represent selection-driven optima (Gould and Lewontin, 1979); defenders of the approach have since distinguished this strong, unfalsifiable use from a weaker, testable one, in which an optimality model is treated as one hypothesis among others about the selective pressures at play (Maynard Smith, 1978; Orzack and Sober, 1994). Human behavioral ecology has applied this weaker, testable logic productively to precisely the kind of high-stakes domains discussed above (Nettle et al., 2013).
The present study adopts the same logic for academic coauthorship: rather than assuming maximization, we ask whether an individual-level payoff structure, calibrated to institutional incentives, reproduces the observed organization-level distribution of strategies without invoking bounded rationality as an explanatory device, and whether the resulting equilibrium generalizes beyond the data used to specify it.
Objectives and Research Questions
The central puzzle motivating this study is straightforward: why don’t authors maximize their publication output through unconditional mutual coauthorship? Under the prevailing scientometric pressure, cooperation appears formally beneficial: if every member of a research group maintained a baseline publication rate (say, two papers per year) and systematically included colleagues from their immediate circle (e.g., their department) as co-authors, each participant's nominal productivity would grow proportionally to the group size. Accordingly, the study addresses four research questions, each mapped to a corresponding stage of the analysis.
RQ1: What is the empirical distribution of coauthorship strategies across Russian research organizations, and how does it relate to per-author productivity and citation impact? - addressed through the empirical analysis stage (Dirichlet regression on the elibrary.ru dataset, reported in Results).
RQ2: Can the observed persistence of Solo and semi-Solo strategies be understood as an equilibrium outcome of strategic interaction under a correctly specified payoff structure, rather than as a departure from payoff maximization attributable to bounded rationality or normative constraint? - addressed through the game-theoretic modeling stage, in which pairwise strategic interactions are formalized as a payoff matrix, introducing plausible, empirically motivated payoffs for cooperative, non-cooperative, and mixed-strategy publication choices.
RQ3: Can an evolutionary dynamic, calibrated to these payoffs and to empirically observed institutional pressures, reproduce the polymorphic coexistence of coauthorship strategies observed in the real data, and what model specifications are required to replicate the observed evolutionary dynamics? - addressed through agent-based modeling.
RQ4: Do the simulated ternary strategy distributions converge with the empirical distributions when compared directly, and where do discrepancies arise? - addressed through the comparative simplex analysis (Results: Model Fit Assessment).
METHODOLOGY
Modeling Approach
This study employs exploratory agent-based modeling (Epstein, 2008), where parameters are calibrated to reproduce empirical patterns and mechanisms are analyzed post hoc. We demonstrate that strategic payoffs combined with external pressures are sufficient to generate observed distributions, following established practices in computational social science (Smaldino and McElreath, 2016), where models serve as "existence proofs" of plausible causal pathways rather than forecasting tools.
Empirical Data
We analyzed the full publication output of 170 Russian research organizations as recorded in eLibrary.ru[1] (accessed July 10, 2025; 11,840,469 publications total). The coauthor distribution data were collected manually per institution via the organizational analytics interface, as automated scraping is prohibited by the platform's terms of service. Organizations were selected via purposive sampling (descending publication count, two size-based clusters, n=99 and n=71); full sampling criteria, exclusion rationale, and verification procedure (repeated extraction for ~10% of organizations, confirming close agreement across access dates) are detailed in Appendix A. The resulting organizational-level dataset (elibrary_2025_170_org) is deposited in the project repository (osf.io/x523p/files/35ntq) to support reproducibility.
Model Fit Assessment
To assess generalizability beyond the calibration sample, we compared the model's simulated strategy distributions against an independent empirical dataset of 446 Russian research organizations (22,165,995 publications total) collected in August 9-15, 2026 using the same manual extraction protocol and descending publication count sampling criteria, applied to a newly identified and substantially expanded set of organizations (467 identified, 446 retained after excluding those with Latin-script names) rather than reusing the 2025 sample. This dataset (elibrary_2026_446_org) is likewise deposited in the project repository (https://osf.io/x523p/files/arucv).
Implementation
The Agent-Based Model was developed in Python 3.9. Source code and additional documentation are available at the project repository: osf.io/x523p.
RESULTS
Distribution of the share density of publications in the Russian Scientific Electronic Library portal
The obtained distribution demonstrates a substantial share of solo authorship, accounting for approximately 30-32% of all publications. The frequency of publications decreases with the increasing number of co-authors, resulting in a right-skewed distribution with a long tail corresponding to large research consortia (15+ authors). Notably, the curve exhibits a wide shoulder: a pronounced peak around single authorship, followed by a wide and prominent second peak corresponding to a significant proportion of papers with a median number of co-authors (approximately 3-4). This second peak reflects the prevalence of intermediate team sizes in the Russian research context, while the long descending tail captures the relative rarity of very large consortia.
This curve can be conditionally divided into three segments that align with the three co-authorship strategies:
The left segment (1 author) corresponds to the Solo strategy, including pure single-author papers and cases where established solo researchers are included as co-authors in works of their students, postdocs, or colleagues.
The central broad segment (2-5 authors) corresponds to the Hierarchical strategy, characterized by a dominant peak in medium-sized teams.
The right tail (6 or more authors) corresponds to the Cooperative strategy, representing a distinct segment of the distribution consistent with a qualitative shift from small-group coordination to network-level collaboration, dominated by large research consortia.
In this study, these three strategies serve as ideal-typical analytical proxies rather than directly observable behavioral categories and are classified exclusively by team size. We rely on team size because it is the only authorship attribute consistently observable across the available in this study data. Direct indicators of role differentiation, proportional contribution, or collaborative intent cannot be recovered from bibliometric records. We fully acknowledge that team size alone cannot distinguish genuine hierarchical exploitation from genuine equal-footing cooperation, nor can it capture authors' underlying motivations.
Processing of Co-authorship Statistics Based on publications from the Russian Scientific Electronic Library portal
Compositional Data Framework and Strategic Aggregation
Given that authorship strategies are represented as proportions that sum to unity (Solo + Hierarchical + Cooperative=1), we treat them as compositional data. Standard multivariate methods are inappropriate due to the constant-sum constraint, which induces spurious correlations. We therefore employ Dirichlet regression-a multivariate generalized linear model specifically designed for proportional outcomes - to analyze how external performance metrics shape strategic composition.
Performance Metrics and Model Specification
Publication strategies were modeled as functions of research group structure and external evaluation pressures. We focus on two institutional performance indicators:
Citation impact: total citations divided by the number of authors, typically highest in organizations engaged in broad collaborative networks.
Productivity (Efficiency): total publications divided by contributing authors, maximized in organizations dominated by individualist strategies.
Strategy proportions Y = (Solo, Hierarchical, Cooperative) were modeled using Dirichlet regression with a log link:

where η k = β k0 + β k1 X 1 + β k2 X 2, X 1 denotes efficiency (publications per author) and X2 citation impact (citations per author). Each strategy receives its own coefficient vector (βk0, βk1, βk2), estimated jointly via maximum likelihood (DirichletReg package, Maier, 2014). No zero values were observed in the compositional outcomes; observations were not weighted by institution size or publication volume - a simplification discussed in the Limitations.
Statistical Results, Robustness check and Interpretation
Defining clear boundaries between the three collaboration strategies (Solo, Hierarchical, and Cooperative) is not trivial, especially for the transition from hierarchical to truly cooperative behavior. While the Solo threshold (1 author) is relatively straightforward and discipline-independent, the cutoff separating Hierarchical from Cooperative strategies is inherently heuristic and may vary across fields. To address this sensitivity, we conducted a dedicated robustness analysis by re-estimating the Dirichlet regression models under three alternative thresholds for the Cooperative category: 5+, 6+, and 7+ authors (Table 1).
| Strategy | Predictor | Threshold 5+ β (SE), p | Threshold 6+ β (SE), p | Threshold 7+ β (SE), p | |||
|---|---|---|---|---|---|---|---|
| Solo | log(Efficiency) | 0.505 (0.211) | 0.017 | 0.444 (0.216) | 0.040 | 0.338 (0.220) | 0.124 |
| log(Cit/author) | −0.921 (0.158) | <0.001 | −0.932 (0.161) | <0.001 | −0.920 (0.162) | <0.001 | |
| Hierarchical | log(Efficiency) | 0.122 (0.241) | 0.612 | −0.080 (0.249) | 0.747 | −0.292 (0.255) | 0.253 |
| log(Cit/author) | −0.987 (0.152) | <0.001 | −0.931 (0.155) | <0.001 | −0.874 (0.157) | <0.001 | |
| Cooperative | log(Efficiency) | −1.219 (0.250) | <0.001 | −1.506 (0.260) | <0.001 | −1.606 (0.264) | <0.001 |
| log(Cit/author) | −0.193 (0.147) | 0.191 | 0.012 (0.147) | 0.932 | 0.122 (0.146) | 0.403 | |
| Mean Coop share | 16.5% | 9.3% | 6.1% | ||||
| Log-likelihood | 402.7 | 460.0 | 506.8 | ||||
| AIC | −787.3 | −902.1 | −995.6 | ||||
Note. Threshold 5+: Cooperative strategy=5 or more authors; Threshold 6+: Cooperative strategy=6 or more authors (primary model, mean Coop=9.3%, consistent with agent-based model equilibrium); Threshold 7+: Cooperative strategy=7 or more authors. Log(Efficiency) negatively predicts Cooperative share across all three specifications (β ≈ −1.22 to −1.61, p<0.001), a more consistent pattern than under the linear specification. Log(Cit/author) negatively predicts Solo and Hierarchical shares across all three specifications (both p<0.001) and shows no significant association with Cooperative share at any threshold. AIC improves monotonically with threshold, reflecting decreasing variance in Cooperative rather than genuine model improvement. Statistically significant results (p<0.05) are indicated in bold.
Both predictors - publications per author (Efficiency) and citations per author (Cit/author) - exhibited pronounced right-skewed distributions (skewness=1.22 and 3.02, respectively). We therefore perform log-transformed specifications as our primary models; this transformation improved model fit substantially over linear specifications (e.g., ΔAIC ≈ 51 at the 6+ threshold) while preserving the qualitative pattern of associations.
We ultimately adopt the primary model with the 6+ threshold, as it yields a mean Cooperative publications share of approximately 9.3%, a proportion that is neither too small to be negligible nor so high as to be theoretically uninformative. This threshold is grounded in empirical evidence on typical research group sizes: Cook et al (2015), surveying 398 UK principal investigators in the biological sciences, reporting a mean group size of 7.3 members (SD=4.5). Kenna and Berche (2012), analysing submissions to the UK's 2008 Research Assessment Exercise for the Statistics and Operational Research unit, report a mean group size of 13 (30 submissions, group sizes ranging from 2 to 30) and estimate a lower "critical mass" of 9±3 members below which research groups become vulnerable to underperformance. Taken together, these independent estimates suggest that a threshold of 6 authors corresponds to at least half, and in some cases the full complement, of a typical research group's membership. This means a publication is classified as Cooperative only when it involves a substantial share - not merely a few - of a typical group's members. Setting this threshold at a minimum of 6 co-authors strikes a reasonable balance between theoretical meaningfulness and empirical realism.
The robustness table reveals several important patterns. Log(Efficiency) is negatively associated with the Cooperative strategy (β=-1.506, p<0.001), and positively associated with Solo (β=0.444, p=0.040), while showing no effect on Hierarchical (β=-0.080, p=0.747). This pattern suggests that organizations with higher publication output per researcher tend to have systematically lower shares of large-group collaborations, consistent with the dilution of individual contribution in multi-author consortia; the log-transformed specification renders this association stronger and more consistent across thresholds than the linear specification did. Log(Cit/author) negatively predicts both Solo (β=-0.932, p<0.001) and Hierarchical (β=-0.931, p<0.001) shares, but shows no significant association with Cooperative (β=0.012, p=0.932). This indicates that organizations dominated by small authorship groups tend to have lower citation rates, while the Cooperative share is unaffected - likely due to high variance in citation outcomes across different types of large collaborations.
Appendix B reports full confidence intervals, average marginal effects, and a robustness check for the primary model. The efficiency-Cooperative association remains essentially unchanged when controlling for organization size (β=−1.506 in both models, p<0.001), and predictor coupling is limited (r=0.321 between log(Efficiency) and log(Cit/author)), indicating the reported associations are not driven by organization scale or multicollinearity.
Modelling Distribution of Empirical data in Simplex Space
Figure 2 visualizes the strategic composition of 170 research organizations in the ternary simplex. Key patterns emerge:
Concentration along Solo-Hierarchical edge
Most observed points cluster near this axis, indicating that purely cooperative strategies are rare in studied Russian research organizations.
Citation gradient (green arrows)
Movement toward the simplex center and Cooperative vertex. Higher citation impact is associated with collaborative practices and network participation. Citation impact exerts a negative effect of nearly equal magnitude on Solo (β=−0.932, p<0.001) and Hierarchical (β=−0.931, p<0.001) organisations, but this effect disappears entirely for Cooperative organizations (β=0.012, p=0.932). Consistent with this near-constant slope across Solo and Hierarchical, the citation-impact vector traces an approximately straight path across the simplex (Figure 2).
Efficiency gradient (white arrows)
Movement toward the Solo vertex along the Solo-Hierarchical edge reveals a systematic three-stage pattern. The efficiency vector originates at the Cooperative vertex and moves sharply away from it (β=−1.506, p<0.001), indicating that organizations with high per-author output are strongly under-represented among large-consortium strategies. As the trajectory continues toward the Hierarchical range, the vector's direction flattens and loses statistical significance (β=−0.080, p=0.747), consistent with efficiency being effectively unrelated to strategy composition at this intermediate threshold band. The trajectory then curves further, ending with a significant positive association at the Solo vertex (β=0.444, p=0.040): organizations with the highest per-author efficiency are concentrated there. This three-stage path-strong repulsion from Cooperative, a flat and non-significant middle at Hierarchical, and positive attraction to Solo-visually reconstructs the same three-way threshold structure (5+/6+/7+) used in the robustness analysis (Table 1). It thus provides independent, geometric confirmation that the boundaries between strategies are not arbitrary but track a genuine, continuous underlying gradient in organizational behavior.
Hierarchical decoupling
Unlike Solo and Cooperative, the Hierarchical share shows no reliable association with per-author efficiency at any of the three thresholds tested, and the point estimate itself changes sign as the threshold rises (β =0.122 → −0.080 → −0.292). This pattern is unlikely to reflect insufficient statistical power alone, since the coefficient is not merely small but unstable in sign across specifications - the signature one would expect from a genuine null rather than an underpowered effect. This observation can be explained either purely geometrically as an inflection point on a single efficiency gradient, or as reflecting a structurally distinct mode of authorship formation. For instance, the composition of such an authorship cluster may be governed by hierarchical relations of subordination, rather than by the pursuit of individual efficiency gains. The present data, however, do not allow us to adjudicate between this account and the purely geometric explanation above.
Trade-off
The two predictors operate in orthogonal dimensions: efficiency disadvantages large collaborations, while citation impact disadvantages individualist strategies.
Game-Theoretic Approach to the Co-authorship Paradox
In a “publish or perish” environment, co-authorship can create the appearance of higher individual productivity. When researchers routinely include colleagues as co-authors while maintaining their own output, the nominal publication count per person increases with group size, even without a rise in actual research activity. Nevertheless, our data show that solo and semi-solo authorship remain widespread, indicating that cooperative strategies coexist with more individualistic publication patterns.
Interaction Payoffs
To formalize the strategic interactions between researchers, we apply a game-theoretic framework. This allows us to move from empirical observations to a mathematical model in which each author type (Solo, Hierarchical, Cooperative) interacts with others according to defined rules and probabilities. The mutual gains and losses from such interactions are presented in Table 2, showing the complete payoff structure for all possible pairwise interactions. Payoffs reflect the asymmetric costs and benefits of different collaboration patterns:
| Focal | Opponent | ||
|---|---|---|---|
| S (Solo) | H (Hier.) | C (Coop.) | |
| S (Solo) | 0 | + 1 (p) / − 1 (r) | + 2 |
| H (Hier.) | 0 | + 1 (p) / − 1 (k) | + 3 |
| C (Coop.) | 0 | + 1 (p) / − 1 (k) | + 2 |
Note. Values represent additional payoffs beyond each agent’s baseline productivity of 2 publications per year. Entries show gains or losses from pairwise interactions: 0 indicates no additional payoff; +1 (p) indicates inclusion as co-author with probability p; -1 (r) or -1 (k) indicates loss due to collaboration failure. Probabilities are set as p=0.5, k=0.25, and r=0.1.
The payoff matrix is asymmetric by design and reflects real academic relations of control, dependency, and unequal bargaining power. The base payoff is fixed at 2 points, corresponding to a justified institutional norm of approximately two publications per year (see Introduction). The payoff matrix captures only the additional gains and losses arising from pairwise encounters.
All additional payoffs represent deviations from this baseline. Inclusion as a co-author in one additional paper yields + 1 point for a focal player, while the loss of a potential publication due to collaboration failure yields − 1 point. Full inclusion in all of an opponent’s publications corresponds to + 2 points, reflecting extensive access to collaborative output.
Opponent is Solo: No collaboration occurs, as solo authors do not initiate joint projects. Consequently, the additional payoff is zero.
Opponent is Cooperative: Collaboration is guaranteed. Cooperative authors are willing to include others in all of their works, granting + 2 points to the opponent. Hierarchical strategists obtain the maximal benefit (+ 3 points) by exploiting cooperators’ networks, resources, and labor while retaining control over authorship and strategic positioning.
Opponent is Hierarchical: In this scenario, interactions are strategic and selective. The Hierarchical does not include all group members as co-authors. Instead, they strategically choose only about half of the researchers, guided by the existing hierarchical team structure. As a result, the focal player receives +1 point with a probability of p=0.5, reflecting the uncertain and selective nature of being chosen as a co-author. And − 1 point when collaboration fails due to hidden strategic behavior, including opponents' delays, conflicts, or exclusion.
For Cooperative and Hierarchical focal players, the probability of failure is higher (k=0.25), reflecting greater vulnerability due to deeper engagement in collaborative processes. For Solo focal players, the probability of failure (including reputational and administrative costs) is lower (r=0.1), consistent with their limited involvement in co-authorship and defensive posture. These penalty probabilities are empirically grounded. Previous studies report that approximately 14-50% of research collaborations fail, often due to conflicts, strategic behavior, or authorship disputes (Smith et al., 2020; Savchenko and Rosenfeld, 2024). Specific forms of misconduct - including authorship misuse, delays, sabotage, and exclusion - are documented across disciplines, with reported prevalence ranging from 1% to 71%, depending on context and definition (Marušić et al., 2011; Majumder, 2016; Smith et al., 2020). Thus, the probabilistic structure of the payoff matrix is not arbitrary but reflects empirically observed instability, conflict, and asymmetry in academic collaboration.
Pairwise Expected Payoffs
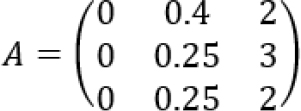
Let A = [a ij] denote the expected payoff matrix derived from Table 3, excluding the constant baseline payoff. Using p = 0.5, k = 0.25, and r = 0.1, we obtain:
| Matrix 1. Cooperative vs Hierarchical |
| Matrix 2. Hierarchical vs Solo |
| Matrix 3. Solo vs Cooperative |
Note. Pairwise Expected Payoff Matrices for Selected Strategy Pairs. Values show expected additional payoffs beyond baseline productivity of 2 publications per year; rows=focal strategy, columns=opponent.E[S vs H]=p-r=0.5-0.1=+0.40; E[H vs H]=E[C vs H]=p-k=0.5-0.25=+0.25. Baseline per agent applies independently. p=0.5, k=0.25, r=0.1.
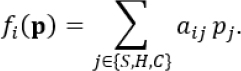
The expected payoff to strategy i in a population with frequencies p = (p S, p H, p C) is
Pure Strategy Stability
We examine monomorphic populations from the focal-player perspective.
All-Solo Population.
All interactions yield zero additional payoffs. Hierarchical and Cooperative strategies do not gain a systematic advantage (u(H, S) = u(C, S) = 0). Thus, All-Solo constitutes a weak Nash equilibrium.
All-Hierarchical Population.
Expected payoffs are u(H, H) = 0.25, while u(S, H) = 0.4. Solo strategies can invade Hierarchical populations.
All-Cooperative Population.
While u(C, C) = 2, Hierarchical agents obtain u(H, C) = 3. Thus, Hierarchical strategies invade Cooperative populations.
Incomplete Cyclical Dynamics
Combining these results yields a partial invasion cycle:
Cooperative→Hierarchical→Solo↛Cooperative.
Each arrow in this cycle corresponds to a symmetric 2 × 2 game with weak Prisoner’s Dilemma structure. In the C-vs-H interaction, payoffs satisfy DC > CC > DD = CD (3 > 2 > 0.25=0.25): defection (H) dominates, but the equality DD = CD implies no unique absorbing equilibrium. The S-vs-H interaction has the same structure (0.4>0.25>0=0). The cycle thus represents a cascade of two weak Prisoner’s Dilemmas, each sequentially eliminating the more cooperative strategy.
The last S-vs-C interaction is degenerate: all payoffs are symmetric (u(S, C) = u(C, S) = + 2; u(S, S) = u(C, C) = 0), yielding no selective gradient between the two strategies. Neither defection nor cooperation is favored, breaking the cycle at this link.
Limits of Analytical Prediction
This simplified analysis cannot account for empirically observed strategy distributions because it omits (i) external institutional incentives, (ii) local interaction structure, and (iii) stochastic fitness variance. These elements are introduced in the agent-based model, which extends the analysis beyond analytically tractable limits.
Agent-Based Modeling
Model Description
Population and Initialization
The model involves a population of n = 250 agents, each adhering to one of three strategies:
- Solo (S): Individualists who publish without co-authors, maximizing personal control while bearing high individual costs.
- Hierarchical (H): Strategists who engage in limited co-authorship based on status and reciprocity, forming strategic alliances with risk of sanctions for unfair practices.
- Cooperative (C): Collaborators who practice broad collaboration, maximizing network effects but facing high risk of exploitation and free riding.
Temporal Structure and Group Formation
The simulation proceeds through T = 80 generations, representing approximately 80 years of academic careers. Each generation (year), agents are randomly partitioned into groups of G = 10 individuals, simulating departmental or laboratory structures. Within each group, agents interact pairwise to determine co-authorship outcomes.
Base Productivity
Each agent produces 2 papers annually as a baseline, reflecting empirical observations of publication expectations in Russian research institutions (see Introduction). This base productivity of 2 points provides a consistent foundation for strategic interactions.
Strategic Interactions and Payoff Structure
Pairwise Interactions
As formally defined in the previous section and presented in Table 3, we initiated agent-based modeling where each agent interacts with others according to the specified payoff matrix. Agents engage in pairwise interactions that yield additional points beyond base productivity. The probabilistic outcomes (p=0.5, k=0.25, r= 0.1) reflect the asymmetry in academic relationships, where hierarchical strategists may include or exclude colleagues depending on context.
Simulation dynamic and Preliminary Sensitivity Analysis
Control simulations reveal a characteristic sequential pattern (Figure 3): Cooperative agents decline rapidly due to exploitation by Hierarchical strategists (u(H, C) = 3 > u(C, C) = 2). Hierarchical strategies persist transiently but gradually lose their advantage as the cooperative pool diminishes. Solo strategies eventually dominate, reflecting structural immunity to exploitation (u(H, S) = u(C, S) = 0) and superior expected payoff against Hierarchical (u(S, H) = 0.40 > u(H, H) = 0.25).
Institutional Pressures, Evolutionary Dynamics, and Mutation
Academic evaluation systems operate under time-varying incentives that shift between productivity- and impact-based criteria. Citation impact and efficiency are modeled as exogenous institutional pressures - reflecting key performance indicators (KPIs) linked to career advancement, remuneration, and employment stability - rather than as emergent outcomes of collaboration structure.
This design introduces the working assumption that one year of activity within a research institution and its constituent departments corresponds to one generation in our ABM; points accumulated over a generation correspond to the number of published papers an agent receives through within-group interaction rounds (here, each agent serves as a proxy for an author who can act strictly within one of the three defined strategies).
We model two exogenous oscillating pressures with period T = 10 generations: efficiency pressure P eff(t), rewarding publication volume, and citation pressure P cite(t), rewarding visibility and impact. The two pressures are phase-shifted by π / 2, producing alternating regimes of efficiency and citation dominance. Strategies differ in their sensitivity to these pressures: Solo agents respond primarily to efficiency incentives, Cooperative agents to citation rewards, and Hierarchical agents balance both.
The period and phase shift of the oscillation are calibrated parameters rather than values derived from a specific empirical cycle. The fact of cyclicality itself, however, is substantively motivated: unlike individual publication output, institutional performance cannot be meaningfully assessed on a one-year basis - evaluating it requires a longer observation horizon, typically on the order of 5-10 years (e.g., accreditation cycles, KPI revisions, or changes in leadership). This motivates the choice of T=10 generations (quasi-years) as a plausible order of magnitude for such institutional cycles, rather than a precise empirical estimate. Similarly, the π/2 phase shift between efficiency- and citation-oriented evaluation periods reflects the substantive assumption that the peaks of these two evaluation regimes do not coincide in time, but the specific magnitude of the shift is not tied to measured data and is chosen illustratively.
Agent i’s total payoff in generation t is:

where u(si,sj) is the pairwise interaction payoff (Table 3) and the constant term represents baseline individual productivity. Evolution follows fitness-proportional selection - a discrete-time analogue of replicator dynamics - in which higher-scoring strategies are reproduced more frequently via weighted sampling:
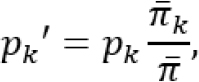
where pk denotes the population share of strategy k,  its mean payoff, and
 the population mean. A mutation rate μ=0.02 is applied at each generation. Following the replicator update, each agent independently mutates with probability μ=2%, independently of payoff; a mutating agent is reassigned to one of the two alternative strategies with equal probability, guaranteeing an actual strategy change rather than a resampling that could reproduce the agent’s current strategy. This continuously reintroduces all three strategies regardless of their current fitness, so that Solo dominance in the main model approaches but never reaches strict fixation - sustained by the constant entry of new Cooperative agents into the game. In substance, μ represents the continuous renewal of research personnel - doctoral students completing their training, researchers moving between institutions, and new hires entering established teams - each entering the system with a strategy not predetermined by the payoffs their predecessors received.
At the start of each generation (quasi-year), the population of 250 agents is randomly reassigned into new groups (“departments”) of 10 - this is group reshuffling. It prevents any single department from remaining in the same fixed composition over time: without it, a given group could by chance settle into a homogeneous composition (e.g., all Cooperative agents) and go years without encountering agents of other strategies. Reshuffling ensures that, over several generations, every agent interacts with a representative cross-section of the whole population rather than the same randomly frozen local environment. This step determines who interacts with whom in a given round and, accordingly, how many quasi-papers and points each agent earns in that quasi-year.
At the end of each round - in our case, each quasi-year period, every agent’s points (quasi-papers) are tallied, and the three strategies begin competing for representation in the next generation at the level of the entire population of 250 agents. This is precisely the procedure of strategy reproduction: the probability that an agent’s strategy is “copied” into the next generation is proportional to how well that strategy performed on average across the whole population in the past year. Strategies that accumulated more points (quasi-papers) in that round become proportionally more numerous institute-wide, while less successful ones shrink. Only after this are agents reshuffled into new groups for the following quasi-year.
Sensitivity analysis of the open model with mutation and institutional pressure across all game and pressure parameters (Appendix D) shows that two additions jointly allow Cooperative agents to survive where they previously went extinct: a mutation rate μ=0.02, and oscillating institutional pressures, which periodically advantage Cooperative agents during citation-dominant phases. At the same time, the cooperative share stabilizes within 6-8% regardless of parameter configuration, never reaching the empirical target of 9.3% as a stable mean.
Exploratory modeling approach
The persistent gap between the simulated cooperative share (never exceeding 8%, see Appendix D) and the empirically observed 9.3% motivated a calibration exercise in the spirit of exploratory modeling (Epstein, 2008; Smaldino and McElreath, 2016). Rather than treating the model as a predictive tool, we used it as a diagnostic device: by identifying parameter combinations capable of reproducing the observed strategy distribution, we reason backwards about the institutional mechanisms that sustain real-world co-authorship patterns.
We calibrated the model to approximate the empirical distribution (∼30-32% Solo, 55-60% Hierarchical, ∼9-10% Cooperative). Following the Dirichlet regression results Table 2), we modulated the efficiency response weight for Solo agents 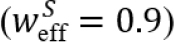 and suppressed overall efficiency pressure
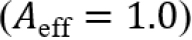 to prevent Solo dominance, while strengthening the citation response weight for Cooperative agents
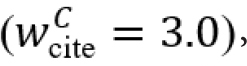 consistent with the empirical finding that citation impact does not penalize Cooperative organizations Table 2), and with the theoretical assumption that KPI-based rewards for citation visibility disproportionately benefit broadly collaborative research.
The calibration also motivated an increase in the oscillation period from T=10 to T=20: longer cycles produce higher peak amplitudes for the Cooperative share and greater cross-sectional variance, both more consistent with the empirical distribution. The introduction of oscillating pressures prevents cooperation from collapsing into a mutation-drift residual and, in some parameter regimes, allows the cooperative share to reach levels consistent with the data (Figure 3).
Figure 4 illustrates that despite successfully approaching the empirical target, the mean cooperative share stabilizes at approximately 9-10% regardless of parameter configuration. The empirically observed 9.3% thus lies near the structural ceiling of what the open-system model can sustainably maintain - a limit that persists even when all available calibration levers (mutation rate, oscillation period, citation weight) are pushed in favor of cooperation.
Model Fit Assessment
Figure 5 compares the simulated strategy distribution with empirical data from 446 Russian research organizations (2026 sample), not used in model calibration, in the ternary simplex.
To assess generalizability beyond the calibration sample, we compared the model’s simulated strategy distributions against an independent empirical dataset of 446 Russian research organizations collected in 2026 from an independently and separately identified, substantially expanded sample of organizations, disjoint in time period from the 2025 calibration sample.
The simulated distribution (Solo=27.8%, Hierarchical=59.9%, Cooperative=12.3%) closely tracks the independent 2026 empirical distribution (Solo=31.0%, Hierarchical=59.2%, Cooperative=9.8%), with absolute differences of 3.2, 0.7, and 2.5% points, respectively. The Mean Squared Error between simulated and empirical mean strategy shares is 0.00058, indicating that the model’s prediction of central tendencies generalizes closely to an independent sample not used in calibration.
Distributional similarity, assessed via Kullback-Leibler divergence, varies across strategies: Solo=0.48, Hierarchical=0.74, Cooperative=0.46. The comparatively low divergence for Cooperative strategies - alongside the smallest absolute mean difference for Hierarchical (0.7 points) suggests the calibration target reflects a genuine, generalizable pattern rather than sample-specific noise. The elevated divergence for Hierarchical strategies, despite near-identical simulated and empirical means (59.9% vs. 59.2%), indicates that while the model correctly predicts the average prevalence of Hierarchical strategies, it underestimates the variance in Hierarchical strategy adoption across organizations - a limitation not visible from mean-based fit alone.
DISCUSSION
A Central Analytical Finding and Its Interpretations: Game-Theoretic and Agent-Based Perspectives
Under “publish or perish” conditions, cooperation appears formally advantageous. If all members of a research group maintained baseline output (two papers per year) and systematically included colleagues as coauthors, nominal productivity attributed to each participant would increase proportionally with group size. Empirical evidence from our data, however, reveals persistent prevalence of solo and semi-solo authorship patterns alongside cooperative strategies.
To examine this puzzle, we integrate large-scale empirical analysis (across 170 Russian research organizations among 11.8 million publications), evolutionary game-theoretic reasoning, and agent-based modeling to examine strategic patterns of academic coauthorship. The novelty of the framework lies in its explicit two level structure: we model strategic choices at the individual level - where authors decide whether to include colleagues as coauthors - and then aggregate these choices through an evolutionary dynamic to generate organization level authorship distributions. This design allows us to link micro level strategic mechanisms to macro level institutional patterns that are directly observable in bibliometric data.
Within a game-theoretical approach first introduced logically motivated payoffs for individual pairwise interactions among the three ideal typical strategies - Cooperative, Hierarchical, and Solo - calibrated to approximate publication outcomes (approximately two papers per year) in which players, depending on their strategy, either included or did not include colleagues as coauthors. We then analysed the outcomes of these games both analytically, through pairwise payoff comparisons, and computationally, using an agent based model. In both approaches, the consistent finding is that Cooperative strategies decline systematically, and the system converges toward Solo dominated equilibria - unless additional mechanisms are introduced to sustain polymorphism.
We further examined various parameter configurations and alternative payoff bonuses for Hierarchical-Cooperative interactions. All other pairwise interactions were predetermined by the definitions of the strategies themselves - solo authorship, by definition, excludes cooperation, while cooperative inclusion entails symmetric inclusion - and therefore did not permit variation in the resulting payoffs. These restrictions are analytical simplifications imposed for tractability, and do not reflect the full range of context dependent behaviours observed in real world collaborations. Under all tested specifications, the ABM consistently reproduced the absence of Cooperative agents across configurations, demonstrating that convergence toward Solo-dominated equilibria within the model is not a boundary artefact of a specific parameter configuration (Appendix C).
We consider at least two theoretical interpretations of this outcome. First, the payoff matrix encodes a non reciprocal chain rather than a closed loop. Within the modeled payoff structure, Solo agents receive authorship credit from Cooperative partners without a reciprocal contribution. Unlike symmetric games such as rock paper scissors, the system contains a structural sink: resources flow toward Hierarchical and Solo strategies and do not circulate back. Within this payoff structure, Cooperative agents systematically receive less than their interaction partners at both ends: they earn nothing from encounters with Solo agents, who gain the full payoff, and only a reduced expected return from encounters with Hierarchical agents, who receive a comparatively higher payoff.
Second, the cascade structure of three sequential games makes this outcome robust to any reparameterisation. Once Cooperative agents are eliminated by Hierarchical exploitation, the H-C payoff becomes irrelevant - there is no one left to exploit. The final equilibrium is determined entirely by the H versus S game, where Solo’s advantage is set by the difference between two penalty terms (p − r=0.40 against p − k=0.25) and is independent of the H-C payoff. No adjustment of the H-C payoff can alter this gap (Appendix C). Paradoxically, Solo emerges as the most resilient strategy not through competitive superiority, but through structural immunity - abstaining from exchange entirely. This outcome aligns with classical Prisoner’s Dilemma logic: when the risk of exploitation is high and the cost of defection is low, withdrawal becomes dominant (Table 3).
Hierarchical agents can dominate Solo only when the cost of non participation in collaborative structures equals or exceeds the cost of participation - formally, when r ≥ k. This condition could in principle be satisfied through several qualitatively different institutional mechanisms that would be mathematically equivalent within the model: for example, a direct penalty on Solo authors, a reputational cost potentially arising from gatekeeping or delayed review, or a collective boost to Cooperative agents through citation-weighted evaluation. We do not test these specific mechanisms empirically; they illustrate the class of real-world processes that our institutional-pressure model is intended to formally approximate. All of these translate into the same structural shift: raising r relative to k. It is this family of mechanisms - not the payoff matrix itself - that the institutional pressure model is designed to capture. The specific empirical proxies we use (publication efficiency cycles, citation per author oscillations, whose incorporation into the calibrated model we discuss below) represent one plausible instantiation; grant allocation patterns, promotion criteria, and peer review dynamics could in principle serve the same function.
Calibrating the Model to Empirical Distributions: Mutation and Oscillating Institutional Pressure as Model-Level Conditions for Cooperative Persistence
To assess whether the evolutionary dynamic could reproduce the empirically observed polymorphism, we calibrated the ABM to match the empirical strategy distribution (∼30-32% Solo, ∼55-60% Hierarchical, ∼9-10% Cooperative).
The calibration was guided by two associations identified in the Dirichlet regression reported in Table 1. Log (Efficiency - number of publications per author) was positively associated with Solo share and negatively associated with Cooperative share among the examined Russian organizations, with no reliable association with Hierarchical share. Log (number of citations per author) was negatively associated with both Solo and Hierarchical shares (both p<0.001), with no significant association with Cooperative share at any threshold tested. These are cross-sectional statistical associations and should not be read as evidence of a causal mechanism acting on individual researchers.
Guided by these associations rather than derived from them directly, we specified two oscillating institutional pressures in the model: an efficiency pressure disproportionately rewarding Solo strategies (with only marginal benefit to Cooperative ones), and a citation pressure disproportionately rewarding Cooperative strategies. Hierarchical strategies were assigned moderate, non-negligible response weights to both pressures, while Solo strategies were specified as largely insulated from citation-pressure fluctuations in either direction. The oscillation period was set to T=20 (quasi-years), longer than the exploratory value of T=10 initially considered, to better align with the cross-sectional variance observed across organizations; this remains a calibrated rather than independently estimated parameter. The model incorporates mutation at rate μ=0.02, which continuously reintroduces strategies regardless of their current fitness. Substantively, this mechanism conditionally represents the renewal of research personnel - doctoral students, postdocs, and new hires entering the collective - whose strategic disposition is not predetermined by the payoffs their predecessors received. Mathematically, it guarantees that at every generation all three strategies, including Cooperative, are reproduced at some minimal rate - the very strategy that, under the baseline payoff structure alone, is subject to exploitation and progressive extinction.
Under this calibration, the model reproduces the empirical distribution of co-authorship patterns across Russian eLibrary-indexed publications with high accuracy (MSE=0.0009 for the 2025 calibration sample; MSE=0.00058 for an independent 2026 validation sample), indicating that the central-tendency predictions generalize beyond the data to which the model was originally tuned.
We interpret this result as consistent with - though not direct evidence for - a broader dynamic in which evaluation criteria in real institutions may shift between productivity-oriented metrics (papers per author) and impact-oriented metrics (citations, H-index). If efficiency pressure were to dominate, as in productivity-focused evaluation systems (Wang et al., 2023), the model suggests Solo and semi-solo strategies would gain a relative advantage; if citation pressure were to dominate, as under H-index-based evaluation (Marzolla, 2015), Cooperative strategies would be disproportionately favored. Hierarchical strategies, carrying intermediate response weights to both pressures, remain adaptive across both regimes in the model - a pattern that may plausibly help explain their high empirical prevalence (∼60%), though this remains a model-based conjecture rather than a tested causal claim. One possible interpretation is that Hierarchical strategies could be advantageous not because they are intrinsically more productive, but because they may reduce exposure to exploitation while preserving partial access to cooperative gains; whether this mechanism operates among real researchers is not tested here and would require independent empirical work.
Within this interpretive frame, oscillating institutional incentives in the model help sustain strategic diversity by periodically offsetting risks associated with cooperation - loss of control, exploitation, coordination costs - rather than eliminating strategic tensions outright. If a comparable dynamic operates in real evaluation systems, it would suggest they can act as stabilizing mechanisms against convergence to purely individualistic equilibria while preserving strategic heterogeneity; we do not test this correspondence directly, and our Conclusion’s caution against one-size-fits-all measures should be read as a policy implication of this model-level finding, not as an assessment of whether current systems already achieve this balance.
At the same time, the modeled pressures (efficiency and citation rewards) are analytically convenient idealized proxies rather than exhaustive drivers of collaboration behavior. In reality, academic co-authorship is shaped by a much richer set of mechanisms, including leadership, compelling research ideas, mentorship, informal norms of reciprocity, and intrinsic motivation to work together (Iglič et al., 2017; Bozeman and Corley, 2004; Savchenko and Rosenfeld, 2024). These factors may reinforce cooperative strategies beyond the minimal structural conditions captured in our formal model. Results should be interpreted with caution: the examined agent-based model is exploratory rather than predictive. Parameters were calibrated to reproduce the 2025 empirical pattern rather than derived independently from first principles or external measurement (Epstein, 2008; Grimm et al., 2005). The 2026 validation merely tests whether these calibrated parameters generalize to new data. The model’s contribution is therefore best understood as a mechanistic demonstration - that strategic payoffs combined with mutation and oscillating institutional pressure can jointly generate a stable polymorphism resembling the cross-section of organizations sampled at different phases of an institutional cycle - while acknowledging that alternative, untested mechanisms could produce a similar empirical pattern (power dynamics, reputational economies, and asymmetric payoffs in team production; Al-Herz et al., 2014; Alexi et al., 2024; Bengiat et al., 2026; Razzaq et al., 2022).
Alignment with the High-Stakes Hypothesis
The empirical distribution of authorship patterns shows limited prevalence of unconditional cooperation, consistent with - though not itself demonstrating - complex strategic choice in academic environments characterized by scarce and highly valuable authorship ‘slots’. Our simulations corroborate this pattern: under conditions where publication opportunities are costly and rewards are tightly linked to individual output, cooperation persists but does not become universal. Instead, intermediate and conditional strategies prevail.
This finding is particularly relevant in the context of contemporary bibliometric incentive systems, which formally promote collaboration. Under uncertainty and competition, actors may plausibly be inclined toward partial cooperation or selective defection rather than full cooperative engagement - a pattern our model formalizes without directly testing the underlying decision process. In settings of intense competition and limited authorship capacity, short-term incentives for retaining credit, avoiding unequal workloads, or minimizing exposure to opportunistic behavior may outweigh the benefits of long-term cooperative engagement (Stephan, 2012; Smaldino and McElreath, 2016). In our model, even strong citation-based institutional pressure does not eliminate Solo strategies, which persist as a substantial share of the population. This persistence need not indicate a failure of institutional pressure to shape behavior; within the model, it instead reflects a stable strategic niche rather than a purely opportunistic departure from cooperation.
Our model is deliberately specified as an open, non-zero-sum system: collaboration is assumed to generate collective benefit rather than merely redistributing a fixed payoff. This assumption is grounded in the empirical data, which include publications co-authored with researchers from other organizations - evidence that collaboration expands the total publication pool rather than simply reallocating a fixed set of authorship credits. This open-system design reflects the general intuition that collaboration can expand the total publication pool beyond what any individual agent could produce alone - for instance through shared ideas, preliminary findings, or citation network effects - though the model does not distinguish between these specific mechanisms and represents their combined effect only as an aggregate payoff gain. The tension thus lies not only in cost of distribution but also in preventing situations where strategic self-interest undermines collective output, as in the classic Prisoner’s Dilemma. The pairwise payoff analysis presented in Section 3.3.5 reveals that this logic operates not once but twice: both the Cooperative-vs-Hierarchical and the Hierarchical-vs-Solo interactions exhibit weak Prisoner’s Dilemma structure, forming a cascade in which defection sequentially eliminates the more cooperative strategy at each level. Analytically, this predicts Solo dominance as the absorbing outcome - a prediction consistent with, though not uniquely confirmed by, the observed empirical distribution of authorship patterns. Nevertheless, we take this correspondence between analytical prediction and empirical calibration as supporting the high-stakes hypothesis: when publication stakes are genuinely high, the aggregate distribution of authorship strategies aligns more closely with game-theoretic equilibrium predictions than is typically reported in laboratory experiments with low-stakes games, where cooperation systematically exceeds Nash equilibrium predictions (cf. Axelrod, 1984; Fehr and Gächter, 2002; Fehr and Leibbrandt, 2011).
Disciplinary Variation and Epistemic Cultures
The strategic patterns observed in this article likely vary between disciplines due to authorship conventions and epistemic cultures (Parish et al., 2018). Prior work suggests that natural and biomedical sciences increasingly favor large teams and distributed credit, reflecting infrastructure-intensive research, while humanities and social sciences have been characterized as emphasizing individual authorship, intellectual autonomy, and personal accountability - a contrast our dataset does not directly test.
These qualitative differences are broadly compatible with model logic, even though the model itself does not parameterize discipline directly. Fields with modular task division may favor Cooperative and Hierarchical strategies, as transaction costs are offset by clear coordination routines. Disciplines emphasizing individual interpretation and authorial voice may favor Solo strategies, where broad collaboration entails higher coordination costs.
CONCLUSION
This study, combining large-scale empirical analysis (170 Russian organizations, 11.8 million articles) and agent-based modeling, provides evidence consistent with academic coauthorship functioning as strategic behavior under limited resources, institutional pressure, and unstable cooperation. We propose a stylized game-theoretic model with three strategies - Solo, Hierarchical, and Cooperative - and a logically motivated payoff structure for their pairwise interactions. In the empirical data, these strategies heuristically correspond to persistent shares: Solo (30%), Hierarchical (60%), and Cooperative (10%). This agent-based model reproduces these empirical distributions with high accuracy (MSE=0.00058) once oscillating institutional pressures and mutation are introduced; without these additions, Cooperative strategies do not persist in the model at all. However, its contribution should be understood as identifying plausible mechanisms rather than definitive causal explanations.
Based on these premises, we conclude academic coauthorship in observed eLibrary publications can be usefully modeled as a non-zero-sum evolutionary game in which dominant strategies depend on external incentives - and plausibly, though untested here, on disciplinary norms and cultural expectations. Within the specified payoff structure, Solo emerges as the most resilient strategy through its structural immunity to exploitation. The persistence of Solo and semi-Solo strategies in the model can be understood as an equilibrium outcome of strategic interaction, while Cooperative strategies collapse - a pattern consistent with strategic equilibrium rather than with bounded rationality or normative resistance to self-interested behavior. Only once mutation, citation pressure, and efficiency pressure are jointly introduced do Cooperative agents accumulate a competitive payoff - apparently driven by the direct citation bonus combined with mutually reinforcing C-C interactions among surviving Cooperative agents, rather than by any advantage in direct pairwise exchange with Solo or Hierarchical partners. In a calibrated model, Hierarchical strategies occupy an intermediate position, balancing network inclusion with authorship control, and are the most stable across the range of institutional conditions we simulated.
These model-based patterns suggest caution toward policies that unconditionally promote cooperation: individual strategies retain value under specific conditions in our simulations, indicating that a purely cooperation-maximizing approach may overlook this heterogeneity. If this heterogeneity extends to real research settings, evaluation systems may benefit from avoiding one-size-fits-all measures and accounting for strategic diversity - though this remains a policy implication drawn from the model rather than a tested recommendation. Future work should examine temporal dynamics, disciplinary differences, status factors, and digital platforms.
A promising direction involves exploring “shadow” interactions invisible to traditional scientometrics: parasitic authorship inclusion and failed collaborations. Agent-based modeling could (1) estimate their scale, (2) identify breakdown scenarios, and (3) analyze factors hindering collaboration realization, complementing existing data on successful cooperation by analyzing the “negative space” of scientific interaction. A theoretically important extension would model the reputational capital that Solo agents contribute when included as co-authors - closing the resource loop and potentially generating rock-paper-scissors dynamics absent from the current open-system architecture.
LIMITATIONS
This study has several limitations stemming from data constraints and model simplifications.
Empirical data
Manual collection from eLibrary.ru was necessary due to copyright restrictions on automated scraping. Additionally, no complete dataset on inter-organizational co-authorship exists. The present study relies on aggregated co-authorship statistics as reported by eLibrary.ru. Article-level data with individual author affiliations could be accessible only via a commercial API license, which requires institutional procurement and was not available for this study. We treat the reported distributions as the best available approximation given current data access constraints.
Model simplifications
Strategies are discrete (Solo, Hierarchical, Cooperative), whereas researchers often combine approaches and shift over time. The model omits disciplinary differences (humanities vs. natural sciences), seniority hierarchies, institutional status, international migration, and career trajectory dynamics-all factors substantially shaping authorship patterns. Additionally, all 170 organizations contribute equally to the Dirichlet regression regardless of publication volume, which may overweight smaller institutions.
The current model simulates departmental structures through fixed-size interaction groups (G=10), but the composition of the group is randomly reshuffled each generation, removing stable ties - persistent laboratory membership, advisor-student relations, and cumulative advantage - that characterize real academic environments. A network variant incorporating fixed interaction graphs or preferential attachment would more realistically capture these dynamics, particularly for Hierarchical strategies, and remains a priority for future work.
The model operates as an open system in which Hierarchical agents can accrue authorship credits from outside the local group. A more realistic closed-system extension - incorporating endogenous surplus accumulation across multiple evolutionary cycles and feedback between authorship allocation and strategy selection - remains a theoretically important direction for future work (Appendix C).
Validation pathways
Future work could also strengthen claims through: (1) temporal prediction using time-series data to forecast strategy shifts following policy reforms; (2) cross-institutional validation testing generalizability across countries and disciplines - the present findings are grounded in the Russian research system, where institutional incentives, evaluation criteria, and collaboration norms may differ substantially from other national contexts, and general-purpose claims require cross-national replication; (3) model comparison against alternative mechanisms (preferential attachment, cultural transmission) to adjudicate strategic vs. non-strategic explanations.
Additional constraints
Classification into S/H/C categories relies on heuristic team-size thresholds, introducing subjectivity, particularly for interdisciplinary works. Discrepancies between simulation and data may reflect omitted institutional barriers (authorship norms, disciplinary traditions, informal restrictions) and cultural/administrative context beyond rational strategic logic. Finally, productivity and citation metrics capture only one dimension of research performance; quality, originality, practical applicability, and cultural significance remain unmodeled.